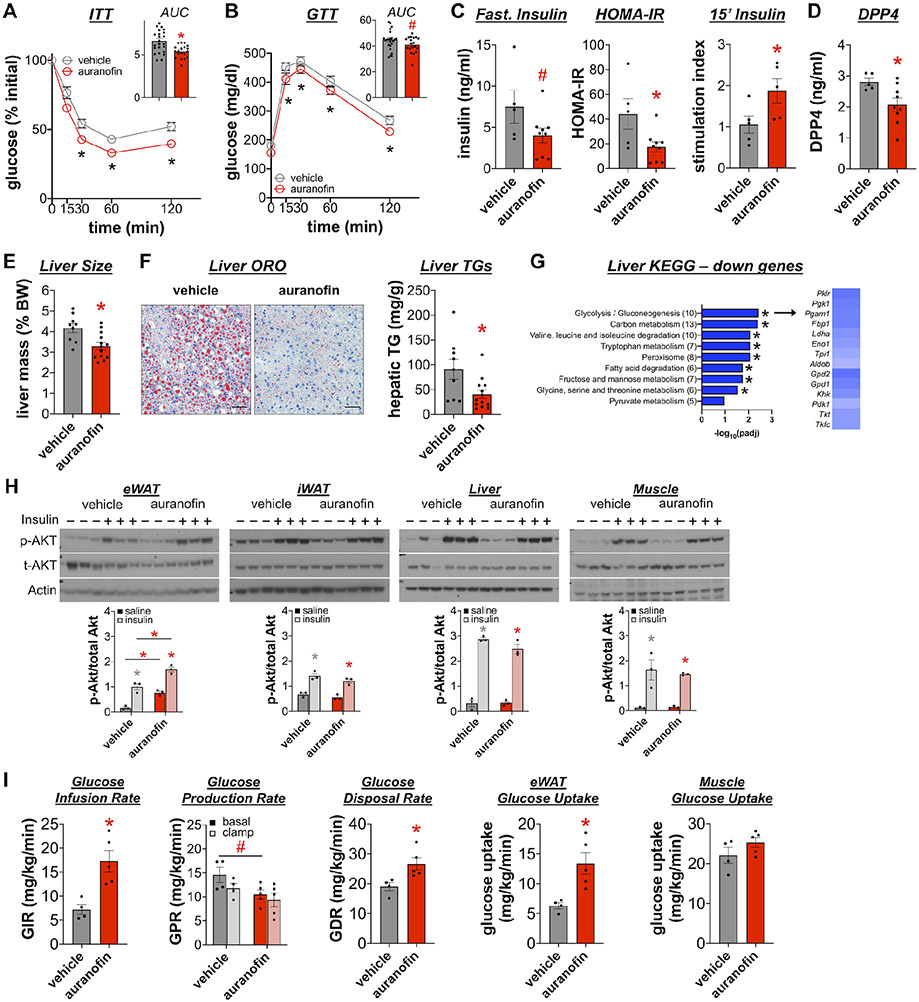
Figure 2. Auranofin improves insulin sensitivity in obese mice.
Mice fed high fat diet (HFD) for 12 weeks were i.p. injected with auranofin (1 mg/kg) or vehicle for 4 weeks. (A) ITT and (B) GTT with corresponding area under the curve measurements (n=19-24/group). (C) Fasting serum insulin, HOMA-IR, and glucose-stimulated insulin secretion (n=5-9/group). (D) Fed serum DPP4 (n=5-9/group). (E) Liver size (n=9-13/group), (F) Oil Red O (ORO) staining of liver sections and liver triglycerides (n=9-13/group), scale=100 μm. (G) KEGG pathway analysis of down-regulated genes by RNA-seq in the liver with auranofin shown as −log10(adj. p-value). Heatmap (right) shows log2 fold change for genes enriched in glycolysis/gluconeogenesis and fatty acid metabolism. (H) Immunoblots of tissue lysates from mice injected with insulin five minutes, probed for p-Akt (Ser473) and total Akt followed by densitometry. Hyperinsulinemic-euglycemic clamp (n=4-5/group): (I) Glucose infusion rate (GIR), glucose production rate (GPR) during basal (dark bars) and clamp (light bars), glucose disposal rate (GDR), and glucose uptake in eWAT and gastrocnemius muscle (muscle).
All data are mean ± SEM. *p<0.05, #p<0.10 by two-way ANOVA with Tukey’s multiple comparison test (A; B; H; I, GPR) and unpaired t-test (A and B, AUC; C-F; I, GDR and glucose uptake).

