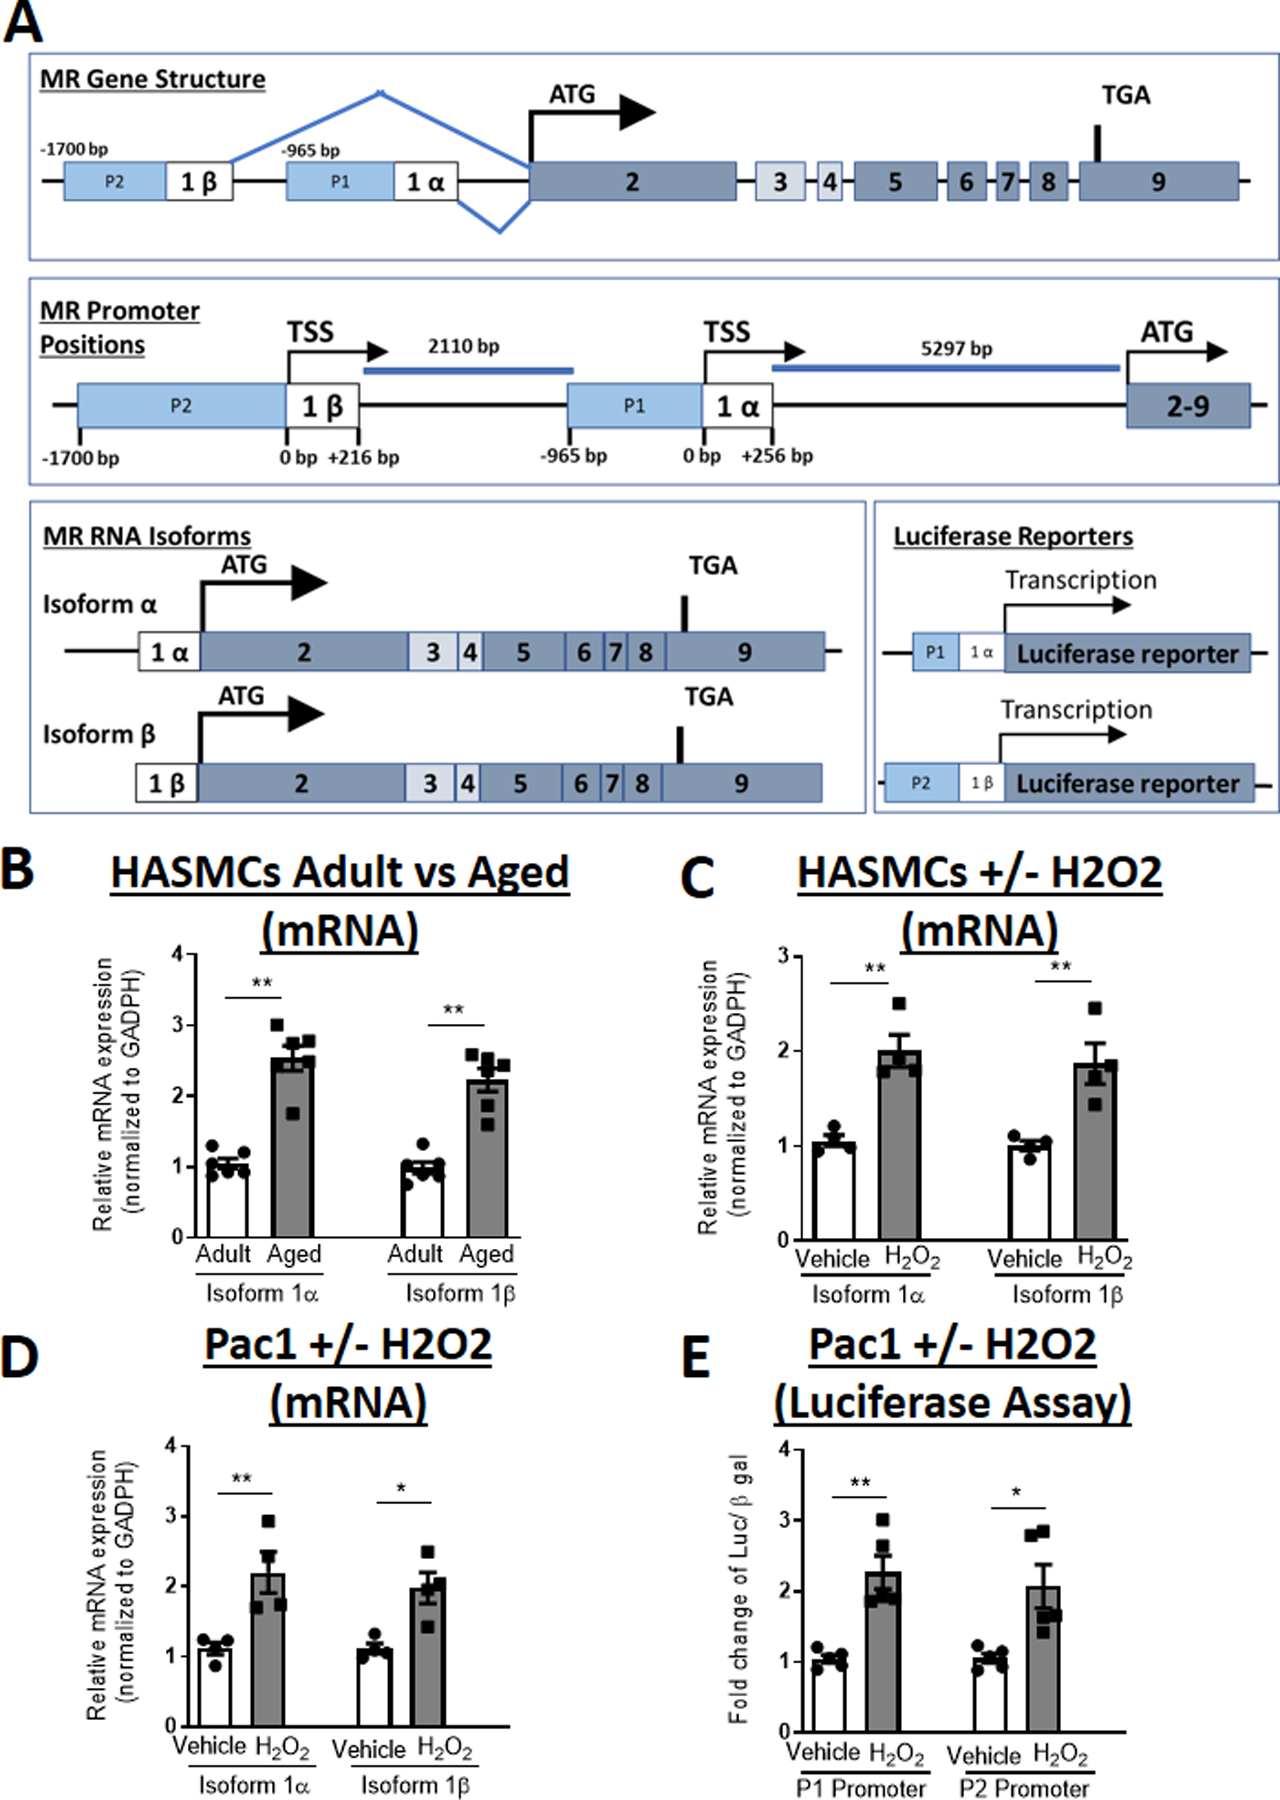
Figure 2. MR-1α and MR-1β Isoform Expression and MR P1 and P2 Promoter Activity Increase with Age in SMC.

(A) Schematic representation of MR gene structure with the translational start site (ATG), two MR alternative first exons with the alternative transcriptional start sites (TSS) defined as base pair (BP) +1 relative to the 1α and 1β exons and the P1 and P2 promoters, alternatively spliced MR mRNA isoforms and luciferase reporters. Quantification of MR mRNA isoforms in: (B) primary human aortic SMC from adult (age 40s) and aged (age 70s) donors. N=6 per age group; (C) adult primary human aortic SMC or (D) Pac1 SMC line treated with vehicle versus hydrogen peroxide (H2O2) for 24 hours. N=4 experiments; (E) Quantification of MR promoter-reporter activity of the P1 or P2 promoters transfected into Pac1 SMC line and treated with vehicle versus hydrogen peroxide (H2O2) for 24 hours. N=5 experiments. Dot plots show the individual data points and bars indicate the mean with error bars indicating the SEM. Student’s t-Test, *p<0.05, **p< 0.01.
