
Figure 3.
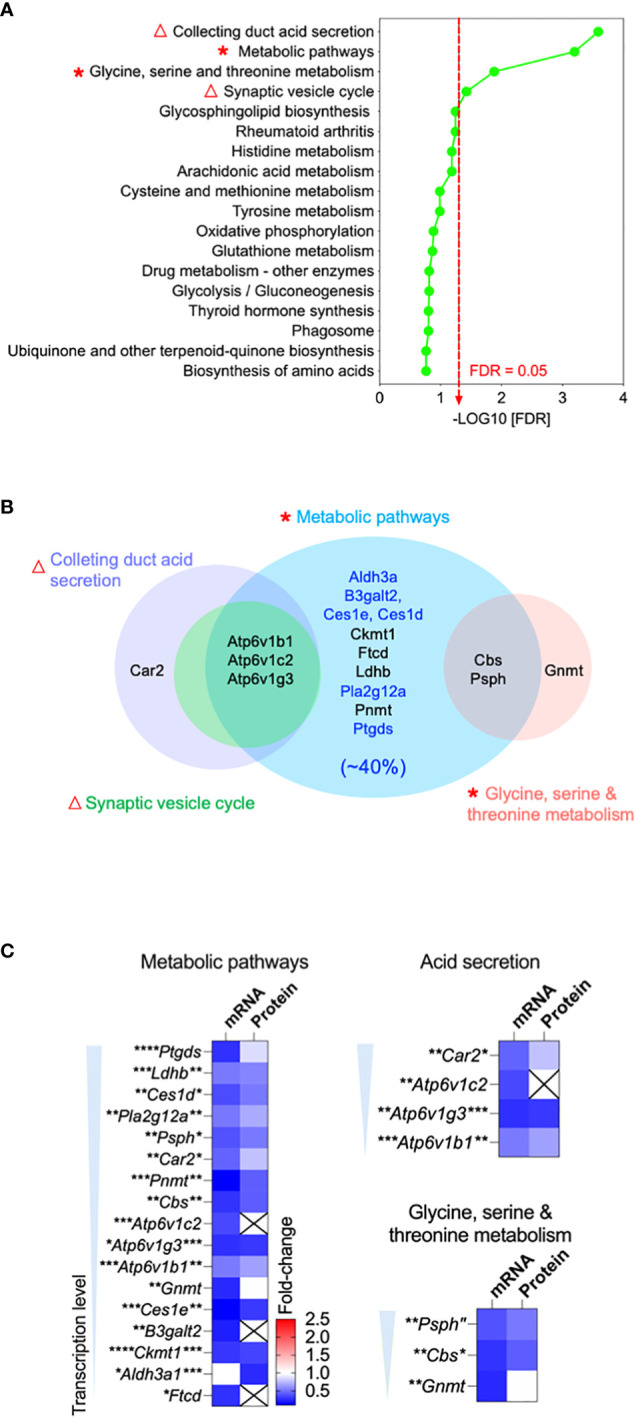
Bioinformatics revealed downregulation of acid secretion and metabolic pathways in the OCLN-deficient epididymis. (A) Integrative bioinformatic analysis revealed the downregulated acid secretion (triangles) and metabolic pathways (asterisks) in the epididymis of OCLN-deficient versus WT mice. Plot showing the enriched KEGG pathway terms obtained using all differential expressed genes (DEGs) of the combined transcriptomic and proteomics of whole epididymis of adult OCLN-deficient versus WT mice. Triangles indicate the impaired acid secretion associated pathways and asterisks metabolic associated pathways. (B) Venn diagram of the shortlisted DEGs in the significantly downregulated metabolic pathways in panel (A) Blue terms indicate the enriched genes for the enzymes relating lipid catabolism pathway, which makes up 40% of the shortlisted genes. (C) Heatmaps showing the fold-changes of transcriptional and proteomic levels of the shortlisted DEGs in the significantly altered pathways, including metabolism, acid secretion and amino acid metabolism. Data were means ± SD from (n > 3 animals per group). *P<0.05, **P<0.01, ***P<0.001, ****P<0.0001, unpaired t-test.