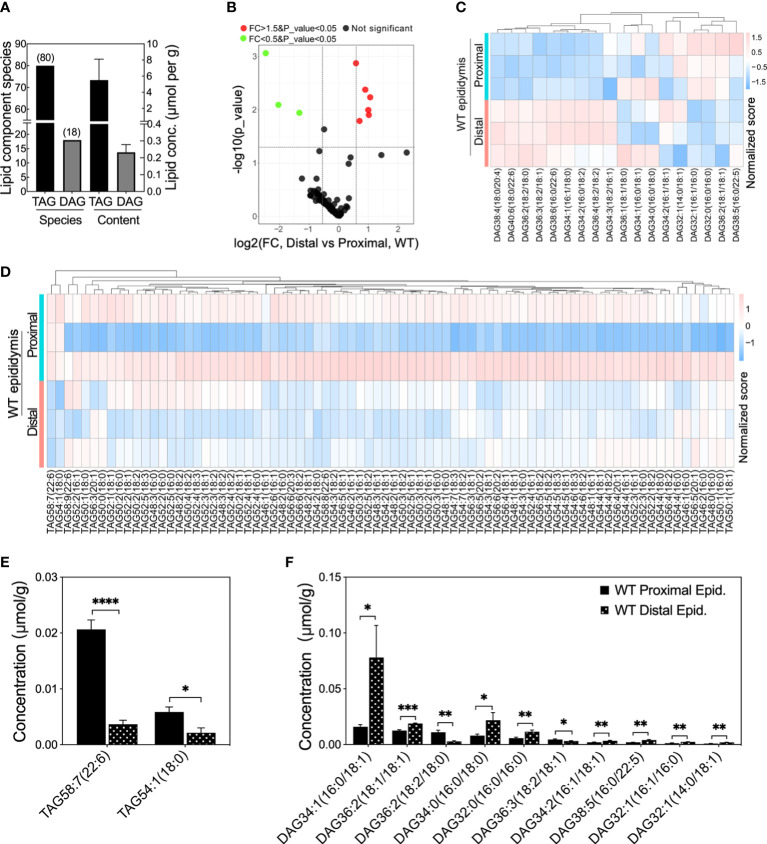
Figure 5.
Lipid compositions at different levels in proximal and distal epididymis of WT mice. (A) Lipid compositions and contents detected in mouse epididymis. (B) Volcano plot of fold change (FC) of TAG and DAG component concentrations detected in the distal versus proximal epididymis of WT mice. Proximal epididymis annotated the samples from regions 1 to 6 whereas distal epididymis annotated the regions from 7 to 10 (n > 3 animals per group). Green dots represent specific lipid concentrations significantly less than 0.5 fold changes (FC) and red dots for those 1.5 folds greater, P<0.05 for both; black dots represent those lipid components have no difference in lipid concentrations. (C) Heatmap showing the row-normalized contents of DAG components in the proximal and distal epididymis of WT mice. (D) Heatmap showing the variations of the row-normalized contents of TAG components in the proximal and distal epididymis of WT mice. (E) Significantly lower levels of specific TAG components and prominent heterogeneous levels of DAG components (F) in the distal epididymis compared to the proximal epididymis of WT mice. Data were means ± SD, two-tailed unpaired t-test, *P< 0.05, **P< 0.01, ***P< 0.001, ****P< 0.001 (n > 3 experiments per group).

