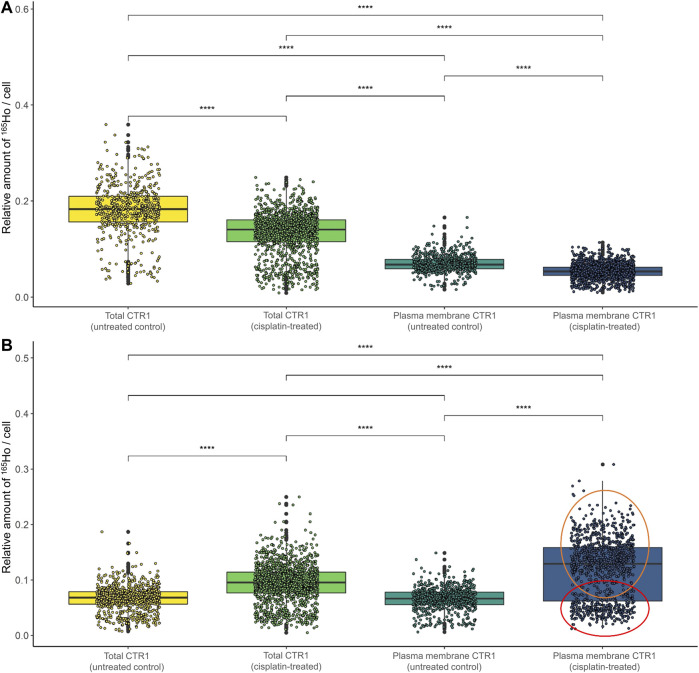
FIGURE 5.
Box plots showing the relative amount of 165Ho cell−1 after size normalization in (A) A2780 and (B) A2780cis cells both untreated (control) and after treatment with 10 µM cisplatin for 6 h. The amount of 165Ho represents the amount of total and plasma membrane CTR1 transporter. The results are based on ∼800 to 1,500 cells for each sample. The red circle shows a cell subpopulation with a low amount of CTR1, whereas the orange circle indicates a subpopulation with a high amount. A Wilcoxon test was performed for the statistical comparison of the different cell types. Significance codes: (*) p ≤ 0.05, (**) p ≤ 0.01, (***) p ≤ 0.001, (****) p ≤ 0.0001.

