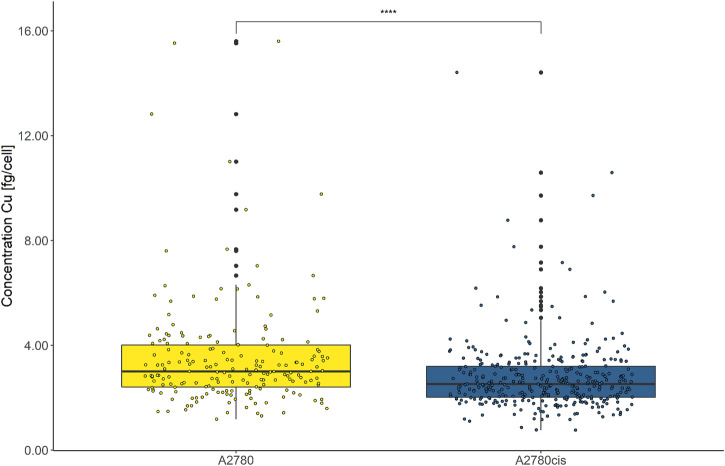
FIGURE 7.
Box plots showing the concentration of intracellular Cu cell−1 of A2780 and A2780cis cells. Cytospin samples were measured by LA-ICP-TOFMS at the single-cell level. All values below the LOD were removed. A Wilcoxon test was performed for the statistical comparison of the different cell types. Significance codes: (*) p ≤ 0.05, (**) p ≤ 0.01, (***) p ≤ 0.001, (****) p ≤ 0.0001.

