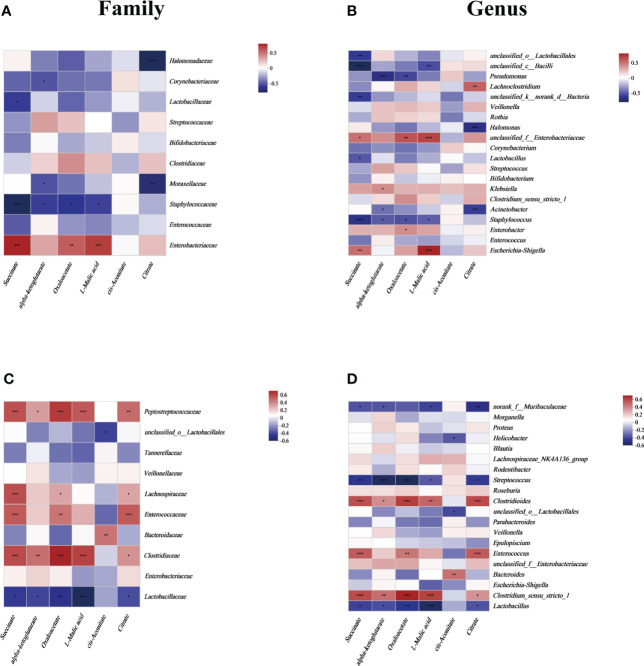
Figure 2.
The relationship between the gut microbiota and energy metabolites at the (A) family level and (B) genus level in human neonates and at the (C) family level and (D) genus level in mouse pups. In the two-dimensional matrix, the color change reflects the data information, and the color depth indicates the data value. The correlation heatmap analysis is based on Spearman rank correlation. Significant differences are shown by *P <0.05, **P <0.01, ***P <0.001.

