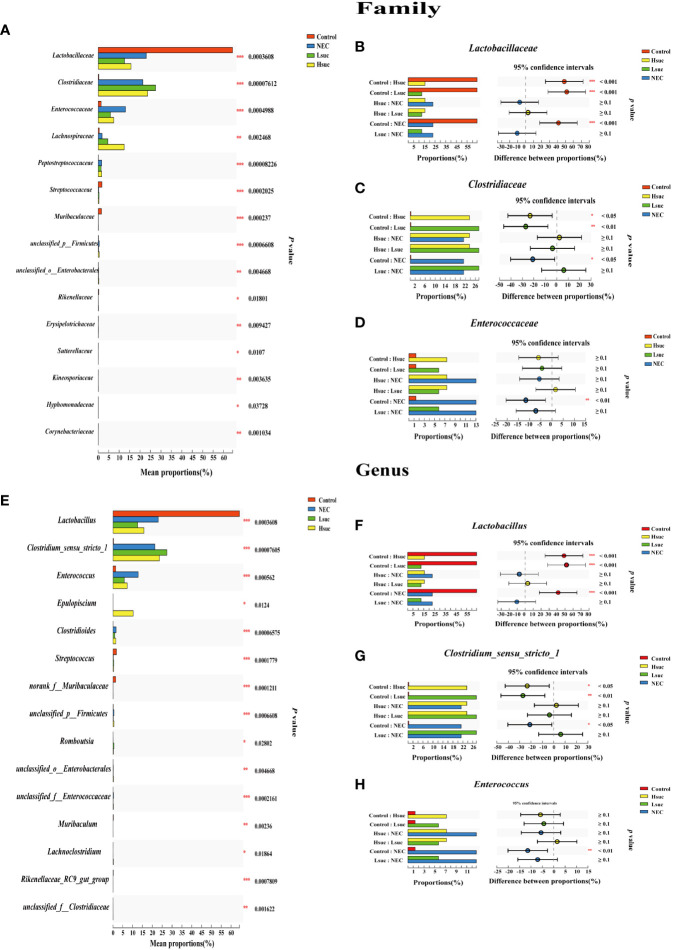
Figure 4.
Comparison of community abundance within four independent groups. Differences in flora composition among groups of mice at the (A–D) family and (E–H) genus levels using the Kruskal – Wallis test with Dunn’s multiple comparison post hoc test. Significant differences are shown by *P <0.05, **P <0.01, ***P <0.001.

