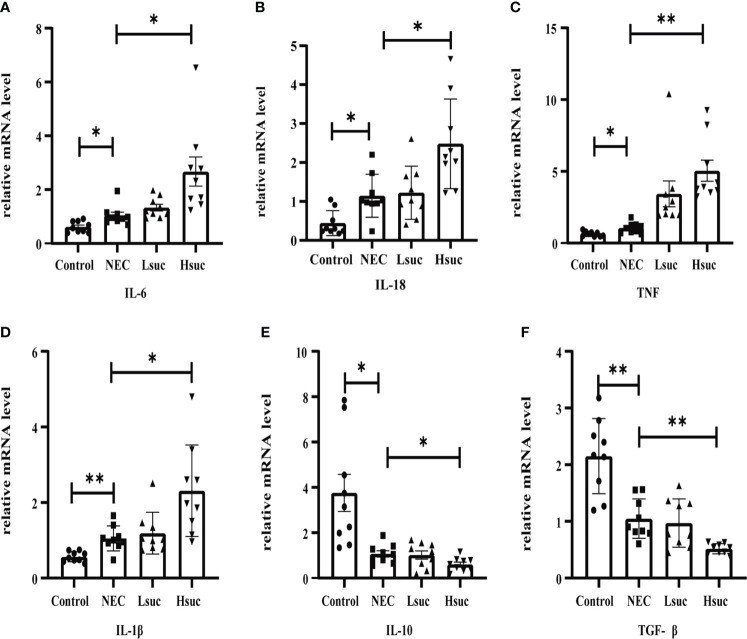
Figure 6.
Relative mRNA expression of inflammatory cytokines in the intestines of mice from four independent groups (n=9 per group). (A–D) Proinflammatory factors; (E, F) anti-inflammatory cytokines. Dots indicate data from individual mice, and data are shown as the means ± SD. Statistical significance was assessed with one-way ANOVA followed by Dunnett’s post hoc test. *P < 0.05, **P < 0.01.

