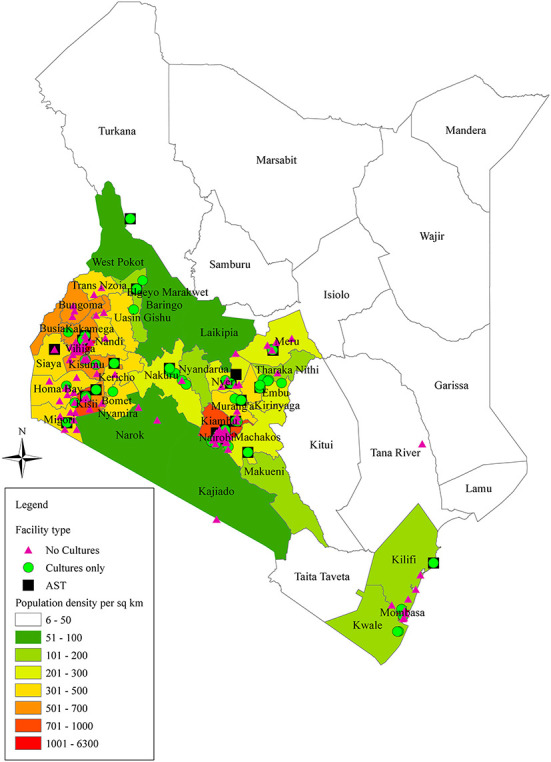
Figure 2.

Map of Kenya representing the geographic locations of the health facilities completing the survey and the population density by location. The figure was generated using pandas and GeoPandas software libraries in Python. Facility type (No cultures; lacking culture testing, Cultures only; performing cultures but no antimicrobial susceptibility testing; AST, Antimicrobial susceptibility testing).
