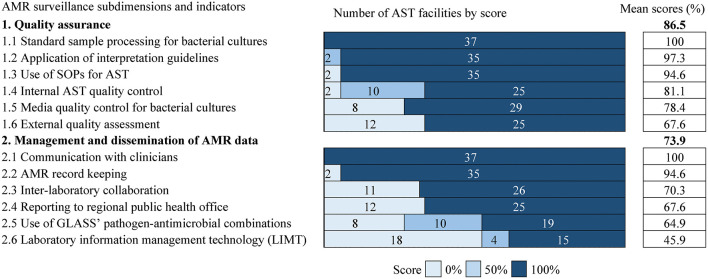
Figure 3.
The figure provides information on the distribution of performance scores for AMR surveillance practices across facilities. The list of subdimensions and their component indicators is on the left. Shading and integers represent scores and facility count, respectively. The scores are ordered from left to right by increasing shade intensity. The number of facilities corresponds to column width. Percentage values on the right are the average score of all cells in each row. Average scores are ranked in descending order by subdimension and component indicator. AST, Antimicrobial Susceptibility Testing; SOPs, Standard operating procedures.

