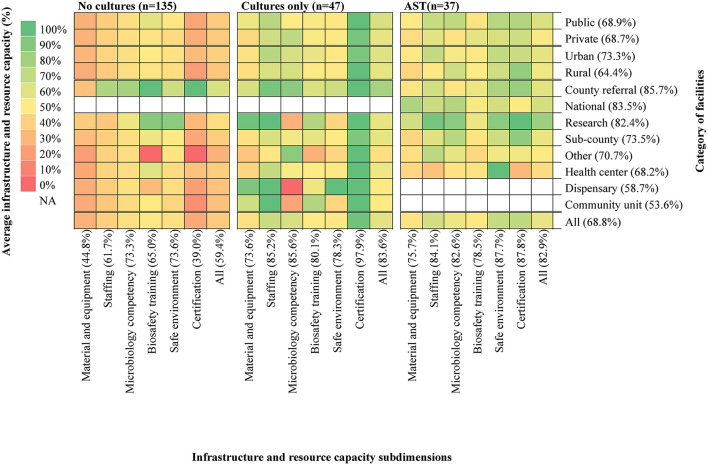
Figure 4.
The heat map details infrastructure and resource capacity scores of the study facilities. The list to the right of the map indicates category names for facility affiliation (Private, Public) urbanicity (Rural, Urban) and level (National referral, Research, County referral, County, Health Centers, Dispensaries and Community units). The category “Other” includes facilities of non-public ownership that fall outside the 6-level structure of the Kenyan health system. The list below indicates the subdimensions of assessment for infrastructure and resource capacity. Indices in parentheses after each category name is the average capacity score of all cells in each row for left list and all cells in each column for list below. Categories are ranked in descending order of average capacity score for affiliation, urbanicity and level, respectively. AST, Antimicrobial Susceptibility Testing; NA, Not Applicable.

