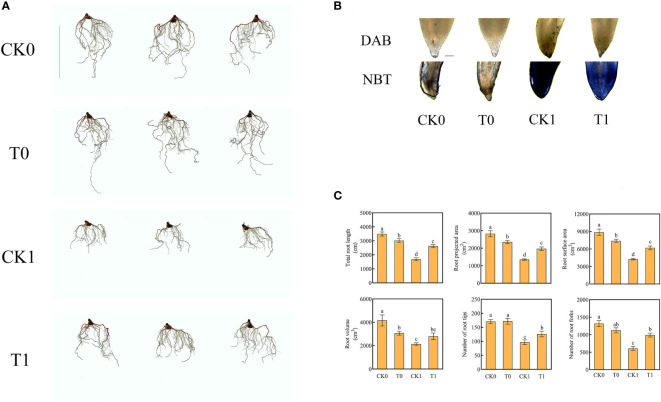
Figure 1.
Root morphology (Ruler represents 20cm) (A), root tips with DAB and NBT staining (Ruler represents 200 μm) (B), total root length, root projected area, root surface area, root volume, number of root tips, number of root forks (C) in the four different treatments. Data were presented as the mean ± SEM for six biological replicate samples. Bars labeled with different letters indicated significant difference between treatments.

