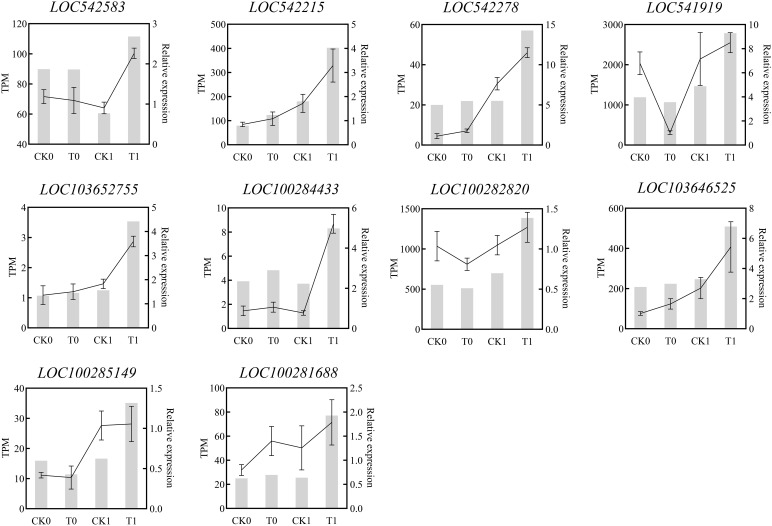
Figure 7.
Quantitative real-time PCR (RT-qPCR) validation of the selected DEGsfrom RNA-seq analysis.The relative expression amount obtained by RT-PCR was expressed by broken lines. RT-qPCR data showed the mean values from three replicates, and the error bars represented the SEM of the means, while the corresponding expression data for RNA-seq were presented in the grey histogram.

