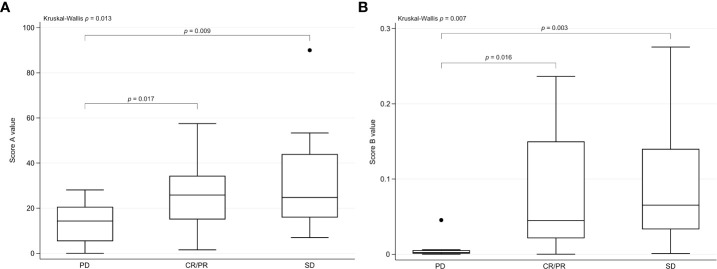
Figure 1.
Scores A and B in correlation with response. (A) Score A values are presented as box plots with median (line) in relation to response to IT (CR/PR, SD, and PD) at first staging. A statistically significant difference for Score A was detected in patients with CR/PR vs. PD (p = 0.017) as well as in patients with SD vs. PD (p = 0.009). In patients with PD, lower score values were detected. (B) Score B values are presented as box plots with median (line) in relation to response to IT (CR/PR, SD, and PD) at first staging. A statistically significant difference for Score B was detected in patients with CR/PR vs. PD (p = 0.016) as well as in patients with SD vs. PD (p = 0.003). In patients with PD, lower score values were detected. Score A , Tregs ÷ (CD4+/CD8+ ratio); Score B , Tregs × HLA-DR+CD4+ T cells × PD1+CD8+ T cells; IT , immunotherapy; CR , complete response; PR , partial response; SD , stable disease; PD , progressive disease.

