Figure 1.
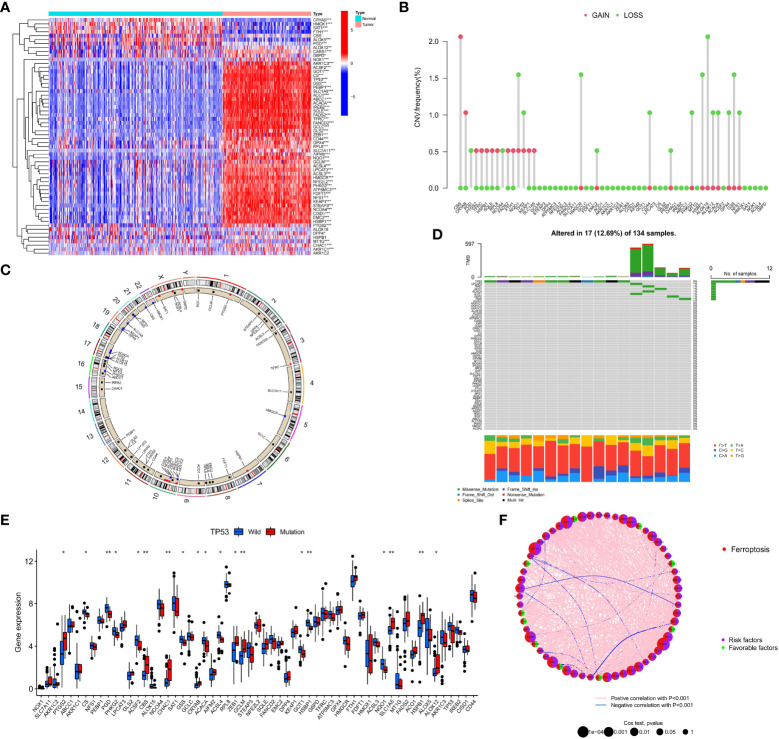
Genetic characteristics of FRGs in AML patients. (A) The heatmap depicts the difference in the expression of 60 FRGs in AML samples and normal samples. Wilcoxon test, *P < 0.05; **P < 0.01; *P < 0.001. (B) CNV frequency of FRGs in the TCGA cohort. (C) The position of FRGs on 23 chromosomes where CNV occurred in the TCGA cohort. (D) Somatic mutations of 60 FRGs in 134 TCGA-LAML patients. Each column in the waterfall diagram represents the mutation type of each patient, the upper part shows the TMB of each patient, and the right side shows the mutation frequency and mutation type ratio of FRGs. The ratio of different base transitions is shown below. (E) The expression of 60 FRGs in TP53 mutation-type patients and wild-type patients, Wilcoxon test, *P < 0.05; **P < 0.01. (F) The interaction of FRGs in AML patients and its relationship with prognosis. Spearman correlation analysis was used to calculate the correlation between FRGs; p<0.001 indicates correlation, pink lines represent a positive correlation, and blue lines represent a negative correlation. Univariate Cox regression analysis was used to calculate the HRs to identify the relationship between FRG expression and prognosis. HR<1: Favorable factors for prognosis, indicated by a green semicircle. HR>1: Risk factors for prognosis, indicated by a purple semicircle. The size of the circle indicates the degree of association between the gene and the prognosis. The larger the circle is, the stronger the association with the prognosis.

