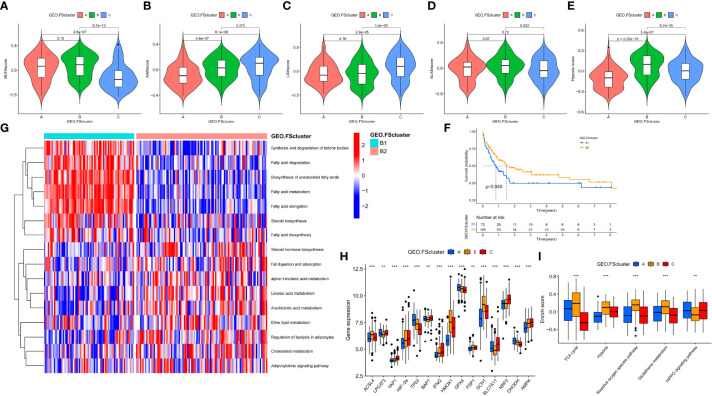
Figure 3.
Analysis of the metabolic characteristics of unsaturated fatty acids in ferroptosis-related molecular patterns and other factors affecting ferroptosis. (A–E) Differences in BUFAscore, AAMscore, LAMscore, ALAMscore, and hypoxia score in different ferroptosis-related molecular pattern groups in the GEO cohort, Kruskal–Wallis test. (F) Kaplan–Meier survival analysis of different cluster subtypes in the FScluster B of the GEO group, log rank test. (G) GSVA showed the activation levels of lipid metabolism pathways in different cluster subtypes. FScluster B of the GEO group. (H, I) Differences in genes and signaling pathways that affect ferroptosis among different ferroptosis-related molecular patterns, Kruskal–Wallis test, **P < 0.01; ***P < 0.001.

