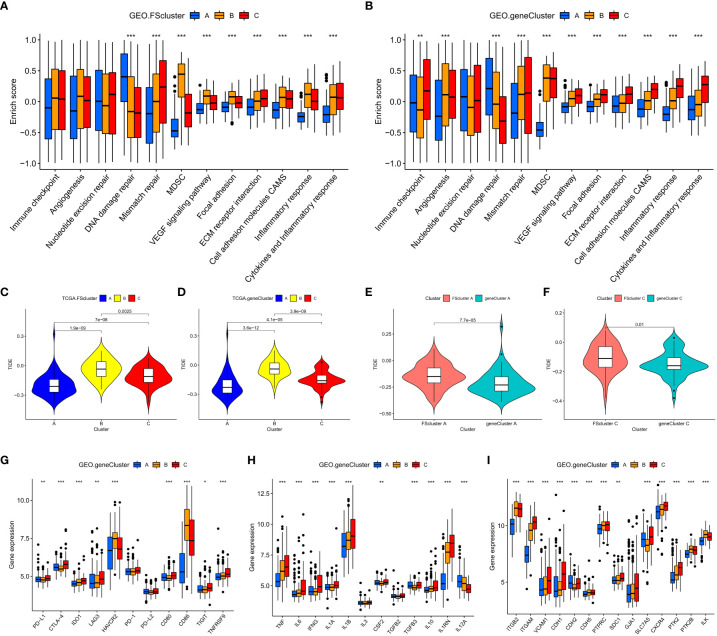
Figure 4.
Analysis of TME characteristics associated with ferroptosis-related phenotypes. (A, B) Differences in pathway signatures related to tumor development and the infiltration level of MDSCs in the TME of ferroptosis-related molecular pattern and genomic subtype groups in the GEO cohort. (C–F) Differences in TIDE scores of ferroptosis-related molecular pattern and genomic subtype groups in the TCGA cohort. (G–I) Differences in gene signatures related to tumor development in the TME of ferroptosis-related molecular pattern and genomic subtype groups in the GEO cohort, G: Immune checkpoint-related genes, H: cytokines related to inflammation associated with AML, I: cell adhesion molecules associated with AML. Kruskal–Wallis test, *P < 0.05; **P < 0.01; ***P < 0.001.

