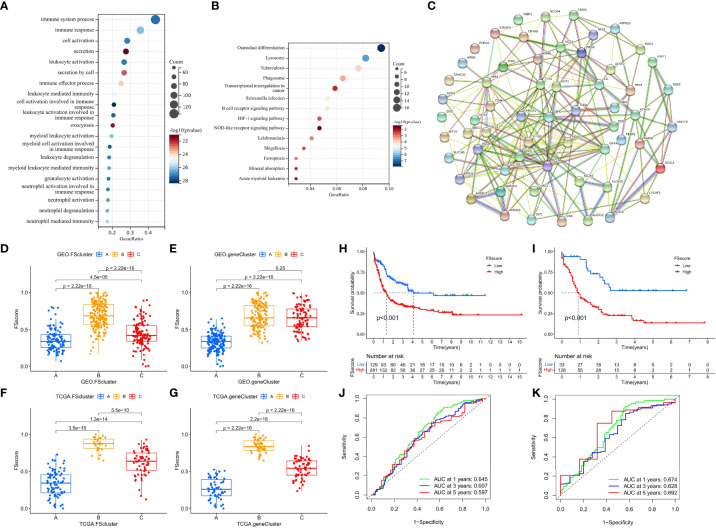
Figure 5.
Analysis TME characteristics associated with ferroptosis-related phenotypes. (A, B) GO annotation and KEGG pathway enrichment analysis showed the functions of the ferroptosis-related phenotype signature genes. (C) PPI network of ferroptosis-related phenotype signature genes. (D–G) Differences in the FSscore of ferroptosis-related molecular patterns and genomic subtypes in GEO and TCGA groups, Kruskal–Wallis test. (D–I) Differences in the survival of patients in high and low FSscore groups in the GEO and TCGA cohorts, (H): GEO group, (I): TCGA group, log rank test. (J, K) The ROC curves showed the specificity and sensitivity of the FSscore; (J): GEO group, (K): TCGA group.

