Figure 6.
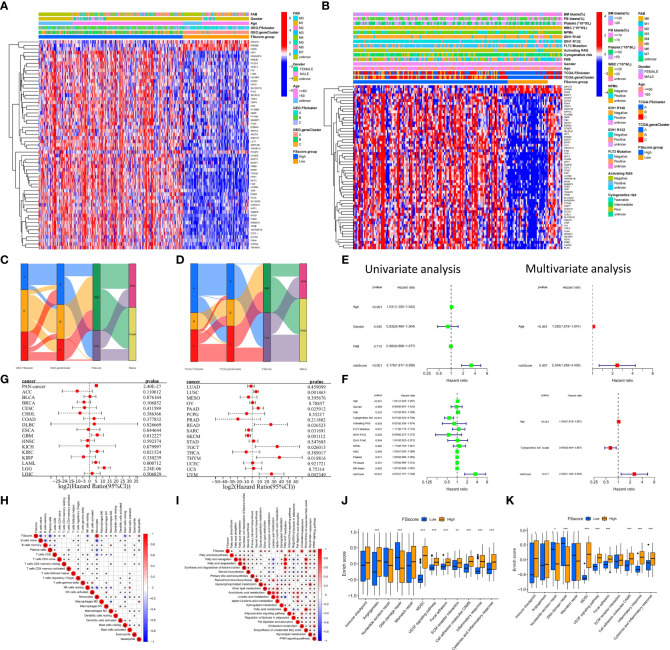
Distribution characteristics and prognostic value analysis of the FSscore, correlation analysis between characteristics of the TME and FSscore. (A, B) Differences in patient distribution, clinicopathological factors and phenotype signature gene expression of the high and low FSscore groups in the GEO and TCGA cohorts, the blank in the annotation of FSscore group in the TCGA cohort is due to the lack of clinical information of corresponding patients. (C, D) Alluvial diagram showing the changes in ferroptosis-related molecular patterns, genomic subtypes, FSscore and patient status. (E, F) Univariate and multivariate independent prognostic analysis of FSscore, E: GEO group, F: TCGA group. (G) Prognostic value of the FSscore in pancancer datasets. (H) Correlation analysis between the levels of TME cell infiltration and the FSscore in the GEO group. (I) Correlation analysis between levels of lipid metabolism and the FSscore in the GEO group. (J, K) Differences in pathway signatures related to tumor development and the infiltration level of MDSCs in the TME in the high and low FSscore groups. D: GEO group, E: TCGA group, Wilcoxon test. *P < 0.05; **P < 0.01, ***P < 0.001.

