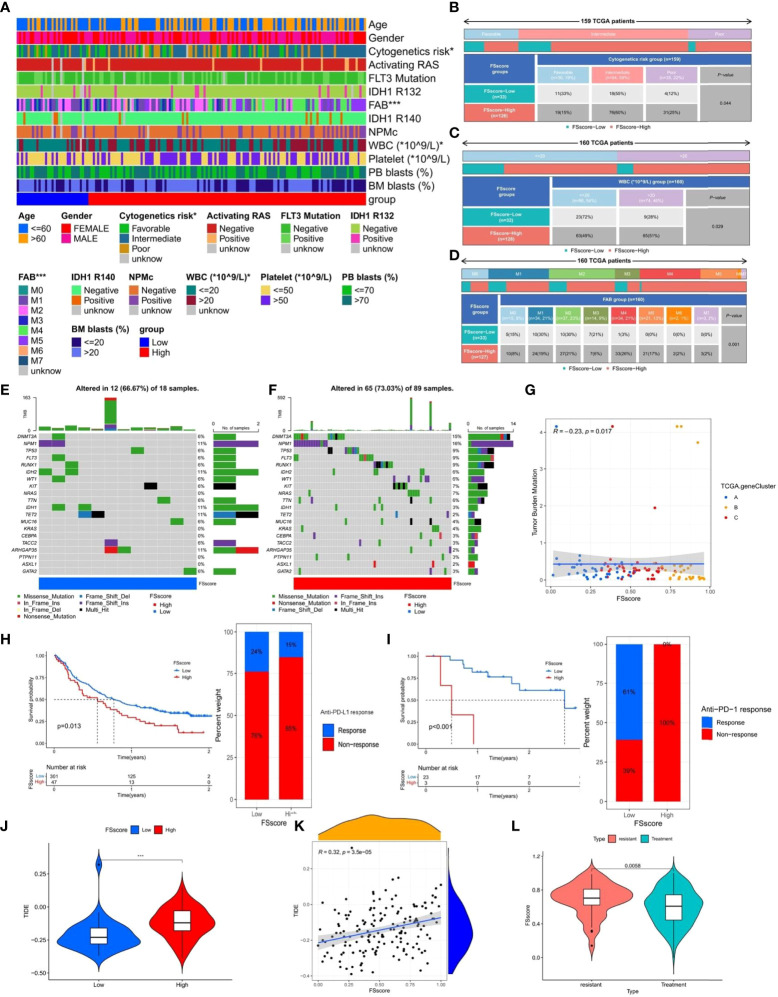
Figure 7.
The relationship between clinicopathological factors, tumor somatic mutations, immunotherapy and FSscore. (A–D) Correlation analysis between clinicopathological factors and FSscore in the TCGA group, Fisher’s exact test, *P < 0.05. (E, F) The characteristics of tumor somatic mutations in the high and low FS score groups of the TCGA group, WBC: white blood cell, PB: peripheral blood, BM: Bone marrow, IDH: isocitrate dehydrogenase, NPMc: nucleophosmin. (G) Correlation analysis between TMB and FSscore in the TCGA group. (H, I) Differences in survival of patients and the proportion of patients in high and low FSscore groups of immune checkpoint inhibitor treatment cohorts (H: IMvigor210, I: GSE78220), log rank test. (J) Differences in TIDE scores of the high and low FS score groups in the TCGA group. (K) Correlation analysis between TIDE score and FSscore in the TCGA group. (L) The difference in FSscore between drug-resistant and nonresistant patients. ***P < 0.001.

