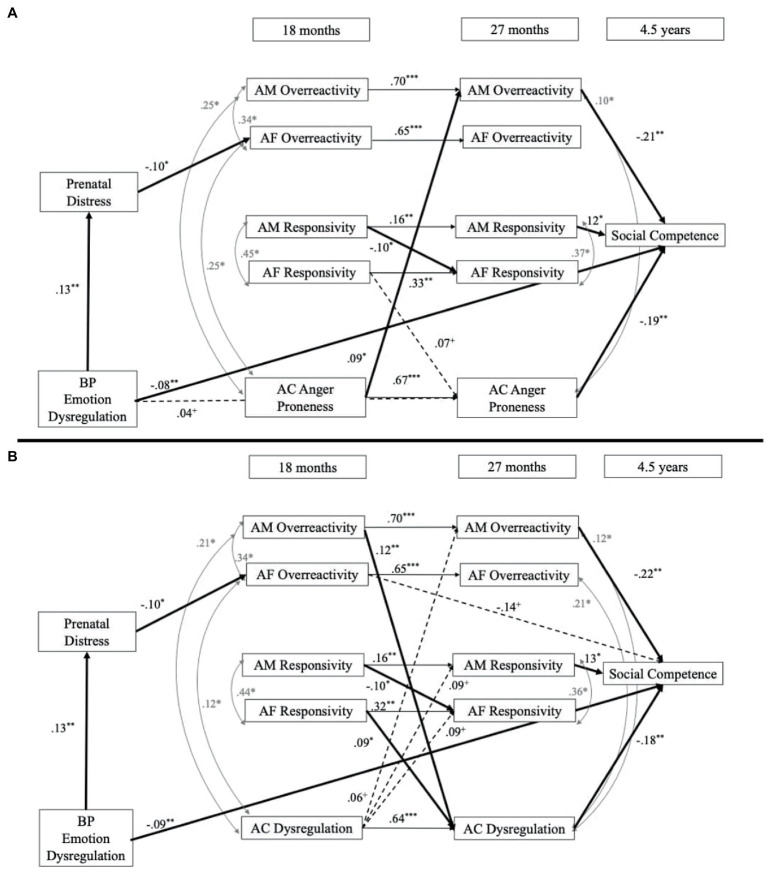
Figure 2.
Birth parent emotion dysregulation models. (A) Presents the results with adopted child reactivity and (B) presents the results with adopted child dysregulation. BP, birth parent; AM, adoptive mother; AF, adoptive father; AC, adopted child. Nonsignificant paths are not included to assist with readability but were included in the statistical model. Solid lines indicate a significant effect and dashed lines indicate a trend-level association. +p < 0.07, *p < 0.05, **p < 0.01, ***p < 0.001. Indirect prenatal effect BP emotion dysregulation-Prenatal distress-AF overreactivity: β = −0.01, SE = 0.01, p = 0.06. Panel A indirect effect AM overereactivity-AC dysregulation-Social competence: β = −0.02, SE = 0.01, p = 0.05. Panel B indirect effect AC reactivity-AM overreactivity-Social competence: β = −0.02, SE = 0.01, p = 0.05.

