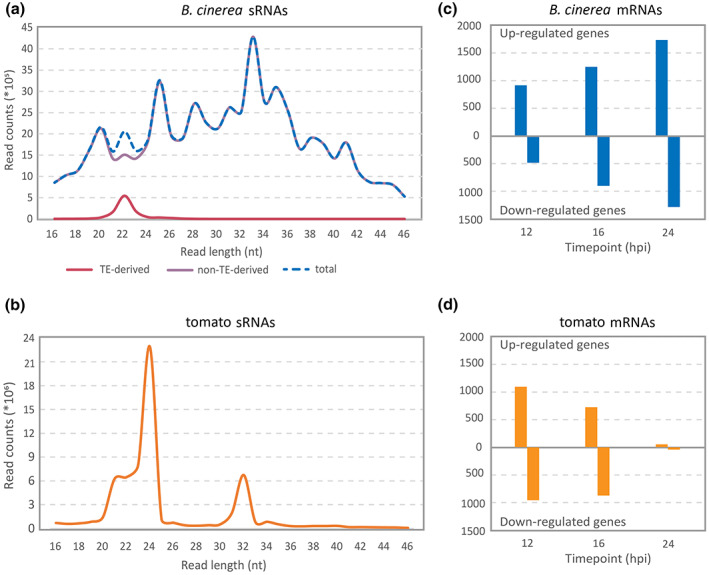
FIGURE 1.

Small RNA (sRNA) profiles of tomato and Botrytis cinerea, and differential expression of plant and fungal mRNAs during their interaction. (a) Read length distribution of unique sRNA sequences in B. cinerea liquid cultures. The pink line represents the transposable elements (TE)‐derived B. cinerea sRNAs, the purple line shows the non‐TE‐derived B. cinerea sRNAs, and the blue‐dashed line represents the total B. cinerea sRNAs. (b) Read length distribution of unique sRNA sequences in the compiled tomato mock‐treated samples (orange line). The scale on the left in both (a) and (b) provides a read count for each read length of the samples. (c) Numbers of differentially expressed genes in B. cinerea at 12, 16, and 24 hours postinoculation (hpi). B. cinerea grown in liquid medium for 16 h was used as control for all three infection time points for the analysis of differentially expressed fungal genes (blue bars). (d) Numbers of differentially expressed genes in tomato. Mock‐treated leaves collected at 12, 16, and 24 hpi were used as the respective controls for B. cinerea‐inoculated leaves collected at 12, 16, and 24 hpi for the analysis of differentially expressed tomato genes (orange bars)
