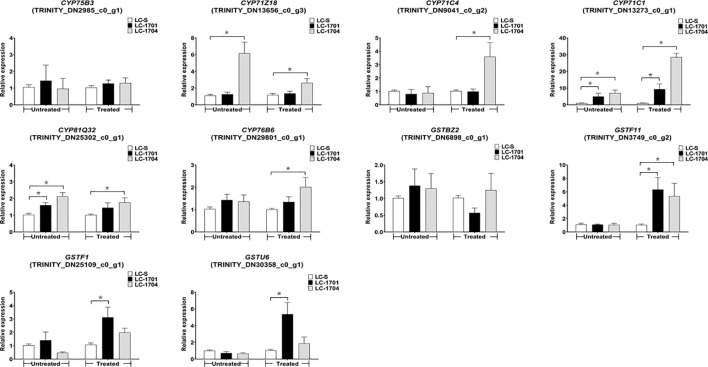
Figure 5.
Relative mRNA expression levels of ten candidate genes in susceptible and resistant populations. The relative expression levels shown on the Y-axis were evaluated by the 2-△△Ct method. They represent the ratios of the normalized expression levels of the candidate genes in the resistant population to those of the same genes in the LC-S population. Results for the untreated and cyhalofop-butyl-treated plants grouped on the X-axis are separately analyzed. Error bars indicate the standard error of the mean for three independent replicates. Asterisks above the error bars indicate significant differences between the susceptible and the corresponding resistant populations in each group (one-way ANOVA followed by the LSD test; * P < 0.05).

