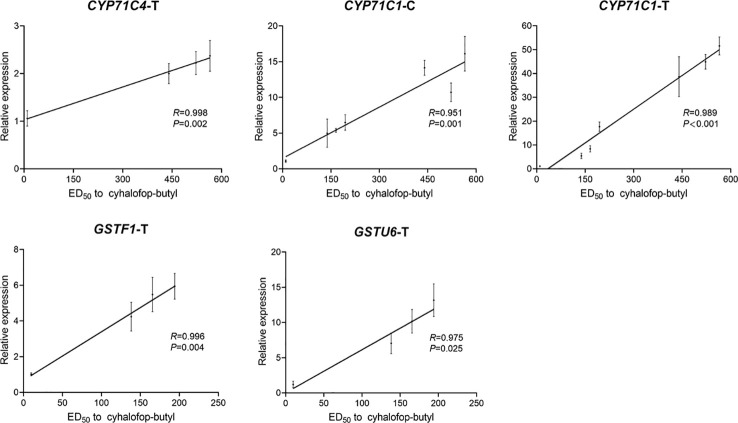
Figure 6.
Correlations between the relative expression levels of candidate genes and cyhalofop-butyl resistance levels in F1 groups. For the untreated groups, the gene is CYP71C1-C. For the cyhalofop-butyl-treated groups, the genes are CYP71C4-T, CYP71C1-T, GSTF1-T, and GSTU6-T. Pairwise correlations between gene expression and cyhalofop-butyl ED50 were determined by Pearson’s correlation analysis in SPSS v. 20.0. Relative expression levels shown on the Y-axis were evaluated by the 2-△△Ct method. They represent the ratios of the normalized expression levels of the candidate genes in the corresponding group to those of the same genes in the LC-S-F1 group. The ED50 values for cyhalofop-butyl are shown on the X-axis. Error bars indicate the standard error of the mean for three independent replicates.

