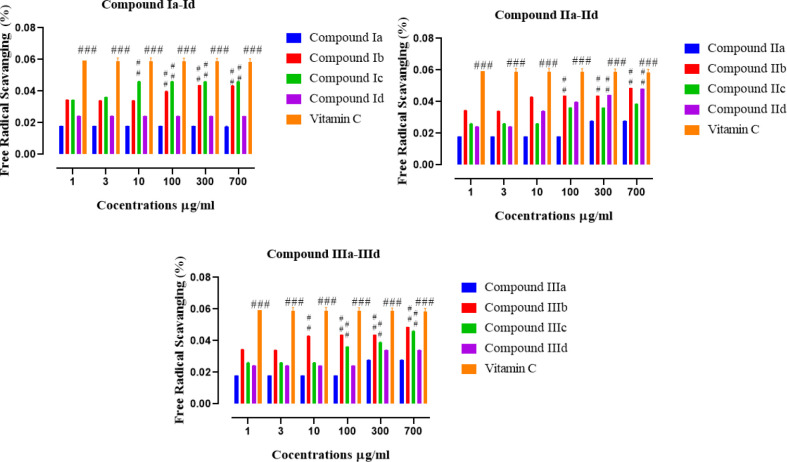
Figure 1.
Illustrates the percent free radical scavenging of all newly synthesized compounds (Ia-Id), (IIa-IId), (IIIa-IIId), and vitamin C. Values are expressed as Mean ±SEM. Symbol *** or ### shows significant difference at P<0.001, while * and ** show significant differences at P<0.05 and P<0.01, respectively

