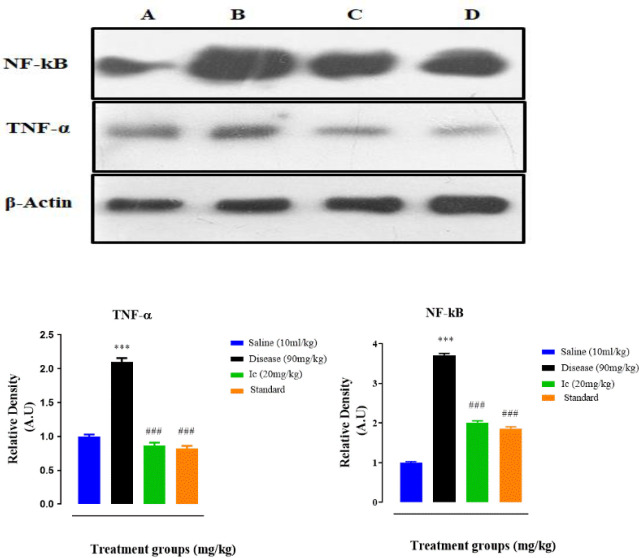
Figure 5.
Inhibitory effect of treated compound (Ic) on tumor necrotic factor alpha (TNF-α) and phosphorylated -nuclear factor kappa B (NF-κB) expression in brain tissues implementing western blot analysis (above). Below is the graphical expression of data analyzed through One-way Anova and post hoc Turkey s’ test. All values were expressed as Mean ±SEM (n = 6). Symbol *** or ### shows significant difference at P<0.001, while * and ** show significant differences at P<0.05 and P<0.01, respectively. The symbol * represents the significant difference relative to the control group and the symbol # shows the significant difference relative to the disease group

