
Figure 1.
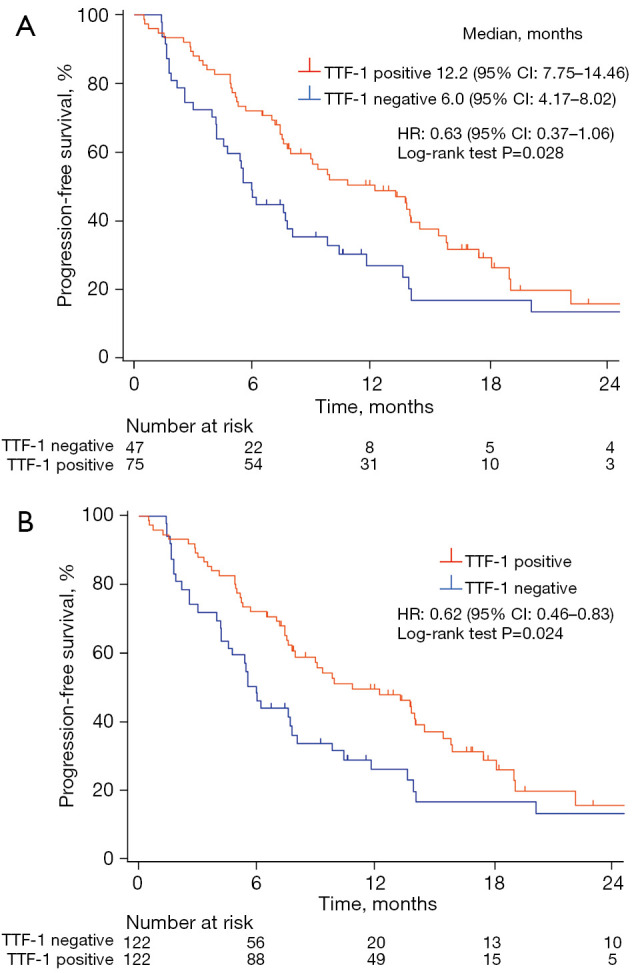
Kaplan-Meier plots for PFS (A) and IPTW-adjusted PFS (B) according to TTF-1 expression status for the study population. PFS, progression-free survival; IPTW, inverse probability of treatment weighting; TTF-1, thyroid transcription factor 1; HR, hazard ratio; CI, confidence interval.