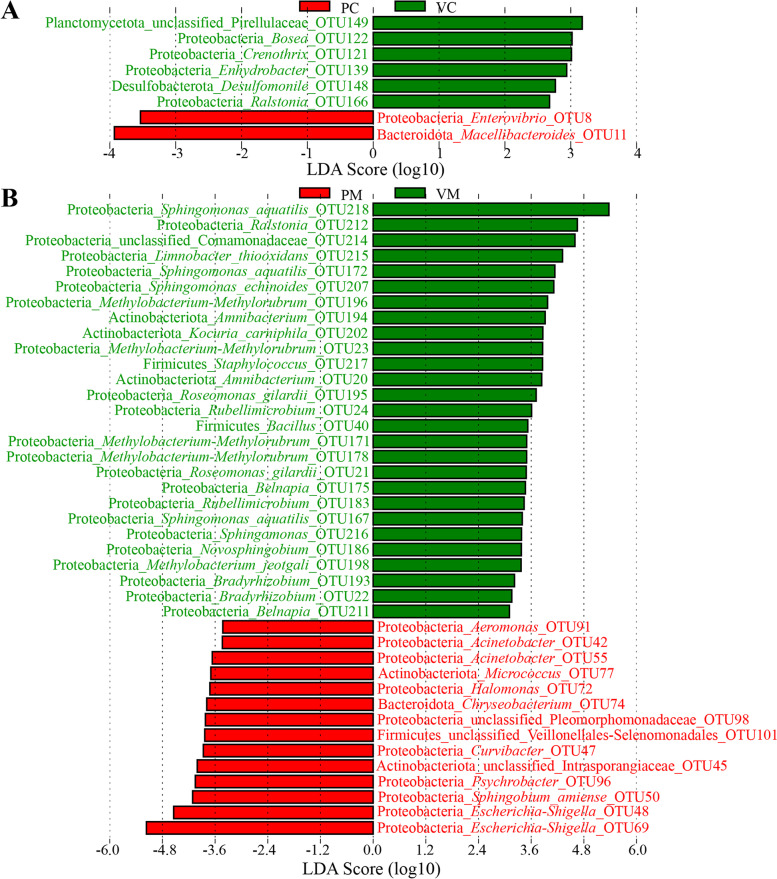
Fig. 3.
Comparison of the intestinal bacterial communities at the OTU level by LEfSe: A comparison of the bacterial communities in the intestinal contents between the control and vaccinated groups, B comparison of the bacterial communities in the intestinal mucosae between the control and vaccinated groups. The highlighted taxa are enriched in the group that corresponds to each color; LDA scores can be interpreted as the degree of difference in the relative abundance of OTUs; PC: intestinal contents in the control group, VC: intestinal contents in the vaccinated group, PM: intestinal mucosae in the control group, VM: intestinal mucosae in the vaccinated group

