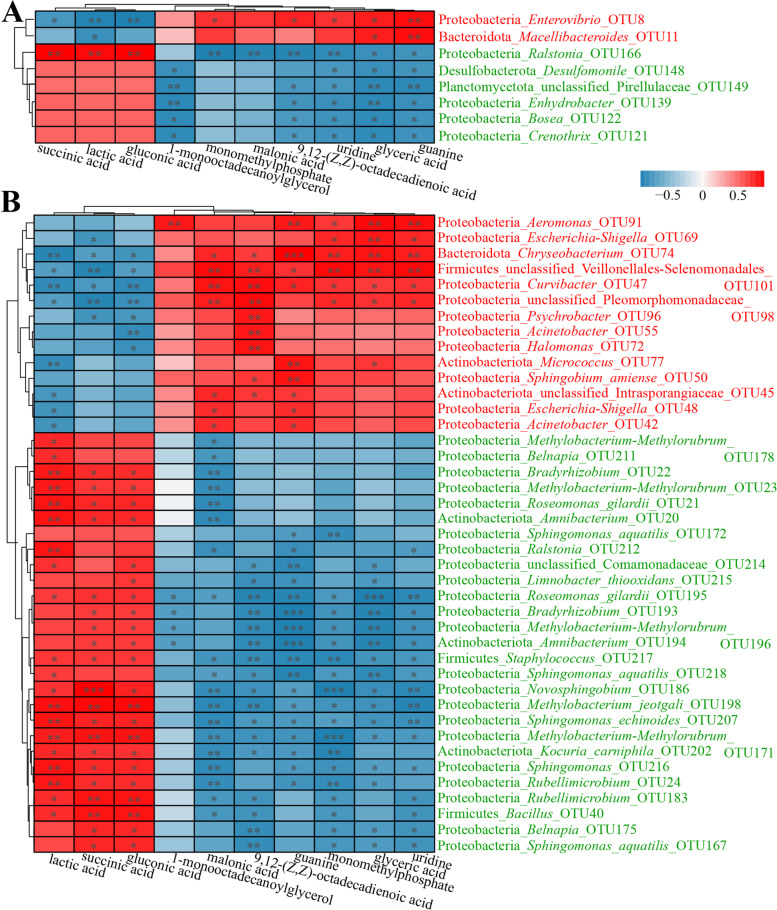
Fig. 5.
Correlation analyses between the differential intestinal microbes and metabolites: A correlation analysis between the differential metabolites and the differential microbes in the intestinal contents, B correlation analysis between the differential metabolites and the differential microbes in the intestinal mucosae. The correlation coefficient is represented by different colors: red represents positive correlation, blue represents negative correlation. *Represents significantly negative or positive correlations: * p < 0.05; ** p < 0.01; *** p < 0.001

