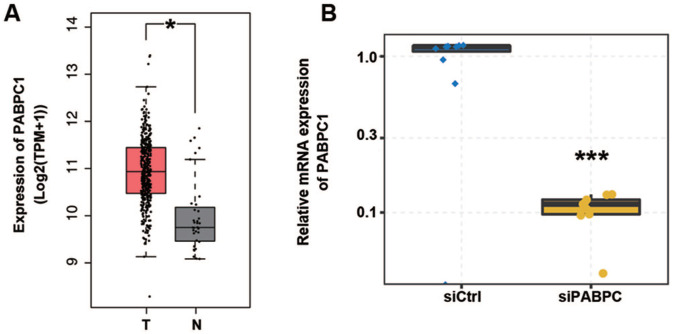
Figure 1.
PABPC1 was down-regulated in gastric cancer tissue and PABPC1 mRNA expression was altered in AGS cells after transfection. (A) Data extracted from TCGA database suggest PABPC1 expression in gastric cancer tissues; boxplots show the median (center line), first quartile (Q1, lower quartile), third quartile (Q3, upper quartile), maximum (the highest data point in the data set excluding any outliers), and minimum (the lowest data point in the data set excluding any outliers); *P < 0.05 versus normal tissues (Student’s t-test). (B) AGS cells transfected with siRNA for PABPC1 or negative control were assayed by qRT-PCR for PABPC1 quantification. Data represent three independent technical repetitions and three independent biological repetitions; ***P < 0.001 versus siCtrl (Student’s t-test). Data are expressed as mean ± standard deviation, where the standard deviation is indicated as error bars. (A color version of this figure is available in the online journal.)

