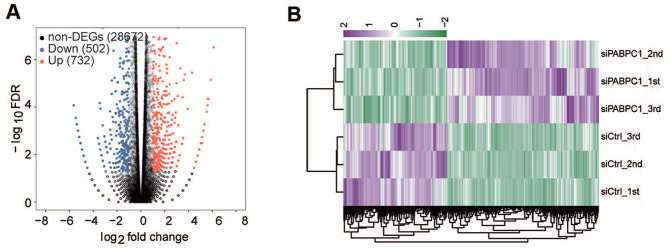
Figure 2.
Identification of PABPC1-regulated DEGs by RNA-seq. (A) Volcano plots presenting differentially expressed genes in AGS cells after transfection with siPABPC1 or siCtrl. The colored dots denote significantly down-regulated (blue), up-regulated (red), or non-differentially expressed genes (gray) in siPABPC1-transfected cells compared to siCtrl-treated cells. (B) Clustering analysis of siCtrl and siPABPC1 groups based on the differentially expressed genes. The top bar values represent the relative expression of the differentially expressed genes. (A color version of this figure is available in the online journal.)

