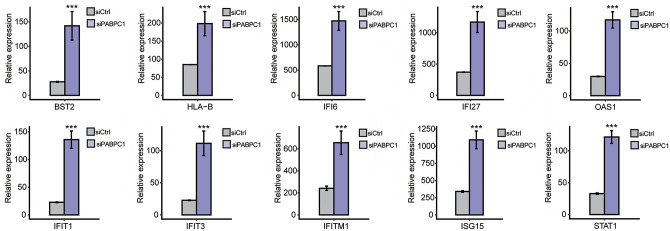
Figure 5.
RNA-seq quantification method for analyzing the transcript abundance of BST2, HLA-B, IFI6, IFI27, OAS1, IFIT1, IFIT3, IFITM1, ISG15, and STAT1 in siCtrl (gray) and siPABPC1 (purple) groups. ***P < 0.001 versus siCtrl (Student’s t-test). Data are expressed as mean ± standard deviation, where the standard deviation is indicated as error bars. (A color version of this figure is available in the online journal.)

