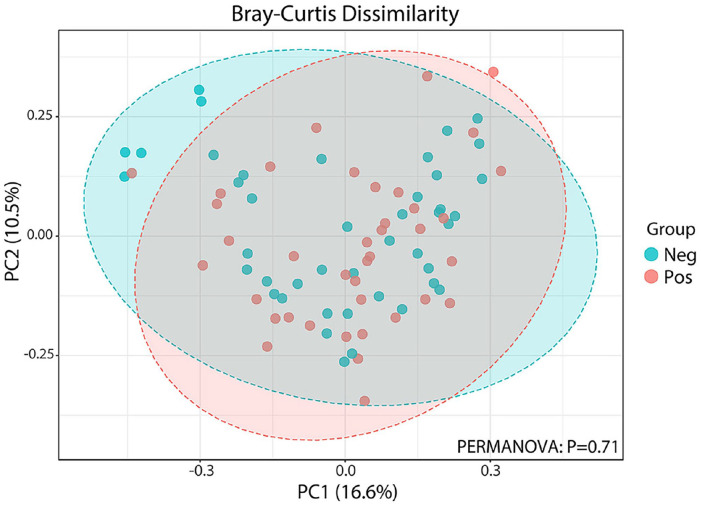
Figure 2.
UniFrac beta diversity in asymptomatic cases with positive versus negative COVID-19. Multidimensional scaling plot from Principal Coordinates Analysis (PCoA) based on Bray–Curtis distances, indicating a clustering pattern among samples obtained from asymptomatic COVID-19 positive (pink) and negative (blue) groups. Permutational ANOVA (PERMANOVA) was used to compare the beta diversity. (A color version of this figure is available in the online journal.)

