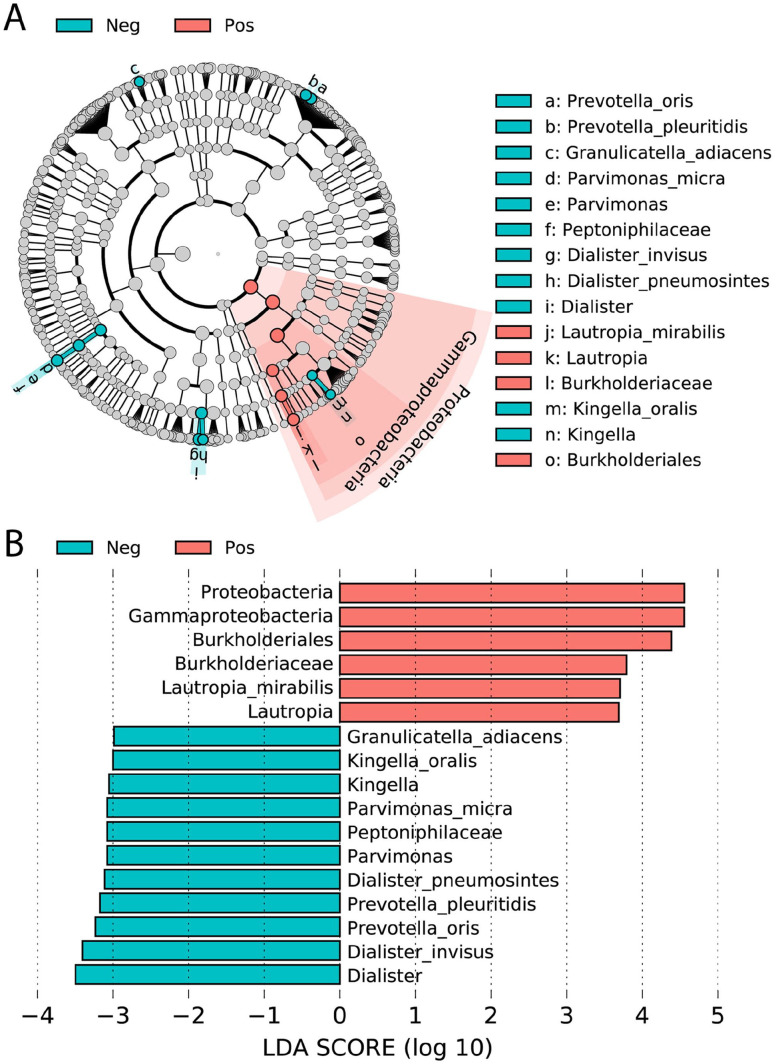
Figure 4.
Linear discriminant analysis Effect Size (LEfSe) of bacterial OTUs. The most differentially abundant taxa between asymptomatic COVID-19 positive (pink) and negative (blue) groups were investigated and represented in the bar graph (A). Cladogram (B) indicated the differentially abundant microbiota at the different taxonomic levels. The LDA score showed the effect size and ranking of each differentially abundant taxon (LDA score > 2). (A color version of this figure is available in the online journal.)

