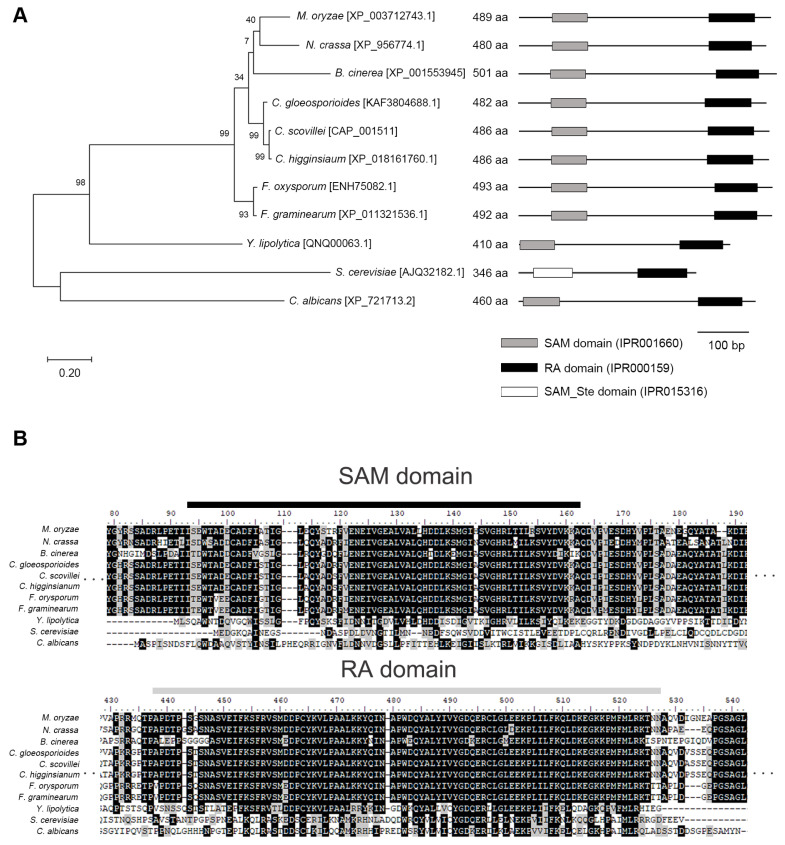
Fig. 1.
Phylogenetic analysis of Ste50 homologs in fungi. (A) Analysis of phylogenetic relationship. A maximum-likelihood tree (500 bootstrap replicates) was constructed using MEGA 6.0. The scale bar represents the number of amino acid differences per site. (B) Alignment of amino acid sequences. The amino acid sequences of the sterilealpha-motif (SAM) and Ras-association (RA) domains were aligned using ClustalW in MEGA 6.0. Identical amino acids and conserved substitutions are shaded in black and gray, respectively. The black and gray lines are the SAM and RA domains, respectively.

