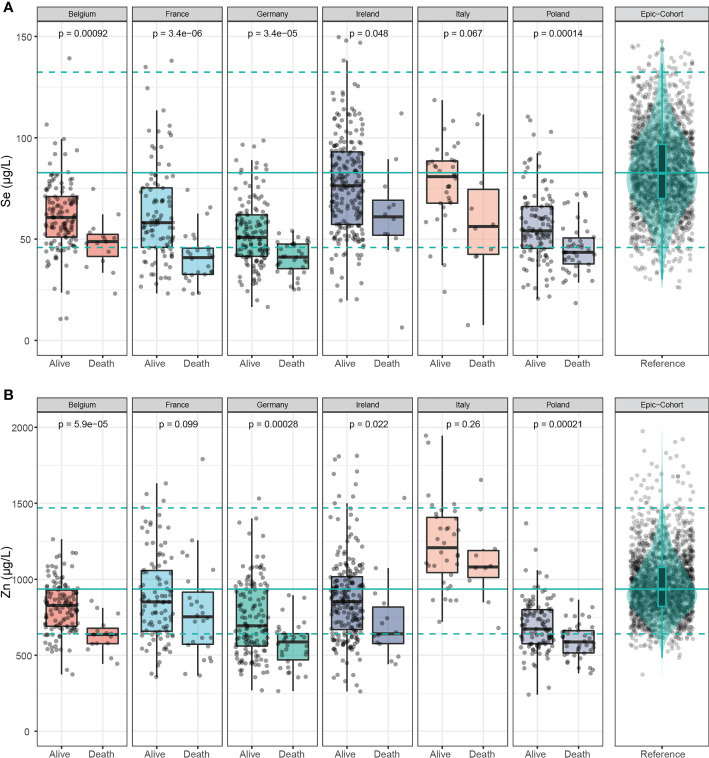
Figure 3.
Selenium and Zn status in samples of deceased and alive patients. (A) Serum Se concentrations were lower in samples of non-survivors than in survivors across all countries. (B) Serum Zn concentrations were also relatively low in the non-survivors across all countries. The green line denotes the median value as determined in EPIC, and broken lines indicate the 2.5th and 97.5th centiles. Results from Wilcoxon-Rank-sum testing are indicated as p-values.

