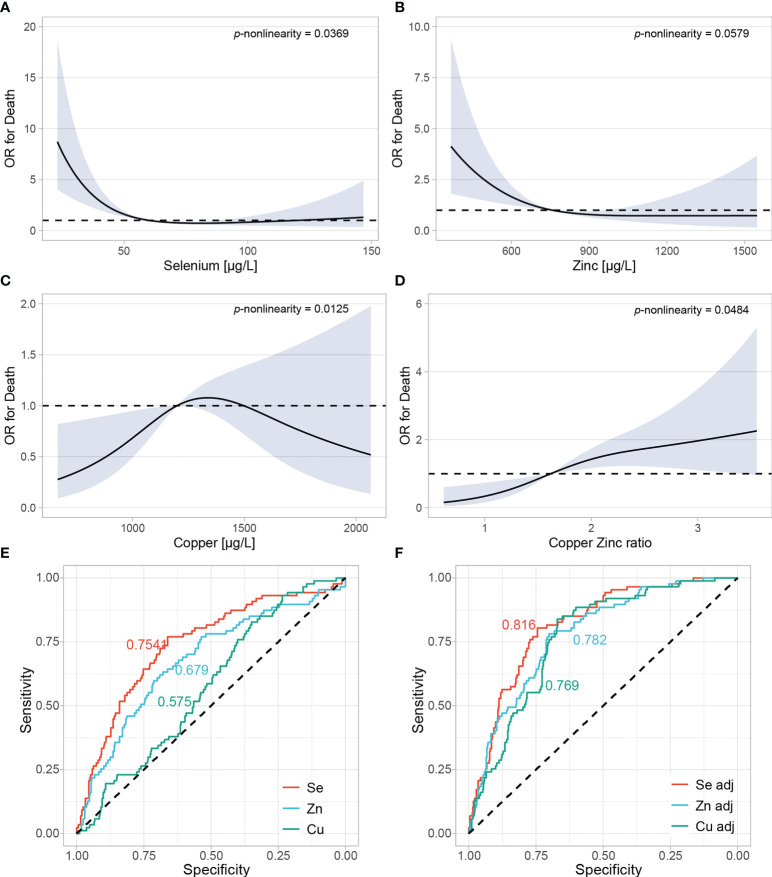
Figure 5.
Adjusted restricted cubic spline regression in a pool of all patients from all countries. (A–D) Restricted cubic spline regression with three knots at 10th, 50th and 90th centiles were conducted to assess the relationship between trace elements and odds ratio (OR) of death. All analyses were adjusted for age, sex, and country of the samples. P for nonlinearity was calculated by comparing nested linear regression models to the restricted cubic splines by likelihood ratio X2 test. (E) Se, Zn and Cu were evaluated as individual predictors in relation to death using the restricted cubic spline model. Areas under the curves (AUC) are plotted for each predictor. (F) Models were further adjusted for age and sex.

