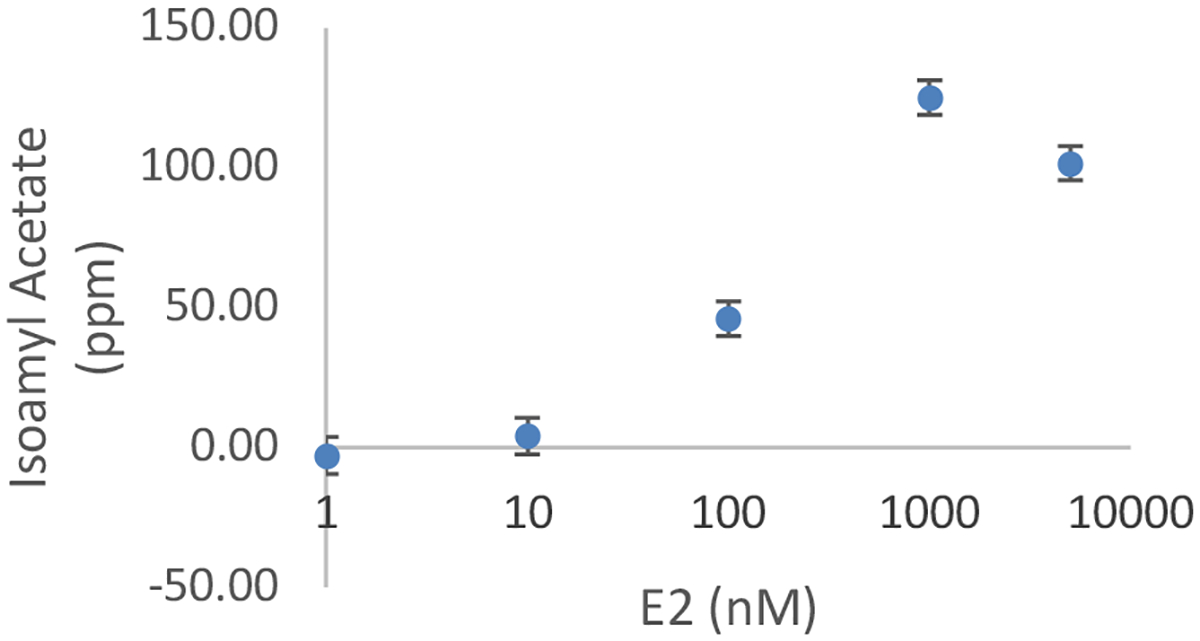
Figure 4.

Estrogen Scentsor Dose Response. Estrogen scenstors were treated with various concentrations of E2 and allowed to incubate for 18 hrs before analysis with GC-FID. 250 ppm isoamyl alcohol was added upon incubation. A representative experiment is shown. Error bars are the std error from the calibration curve. Note the log scale on the x-axis. 1 nM appears to drop below 0 ppm isoamyl acetate because the calibration curve does not go through the origin.
