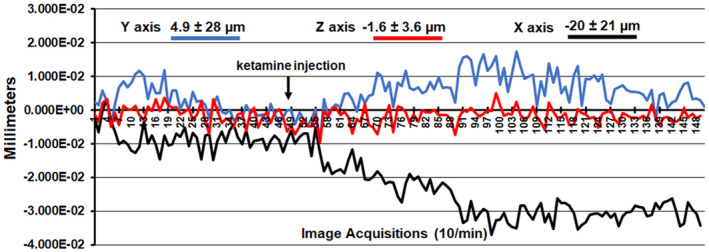
FIGURE 1.

Motion artifact. Shown is the degree of motion artifact recorded over the 15 min imaging protocol. The data are reported as the mean and standard deviation in micrometers for axis Y, Z, and X for the eight mice injected with the 10 mg dose of esketamine. The largest movement in the X axis (left to right head motion) was ca 40 μm for any mouse.
