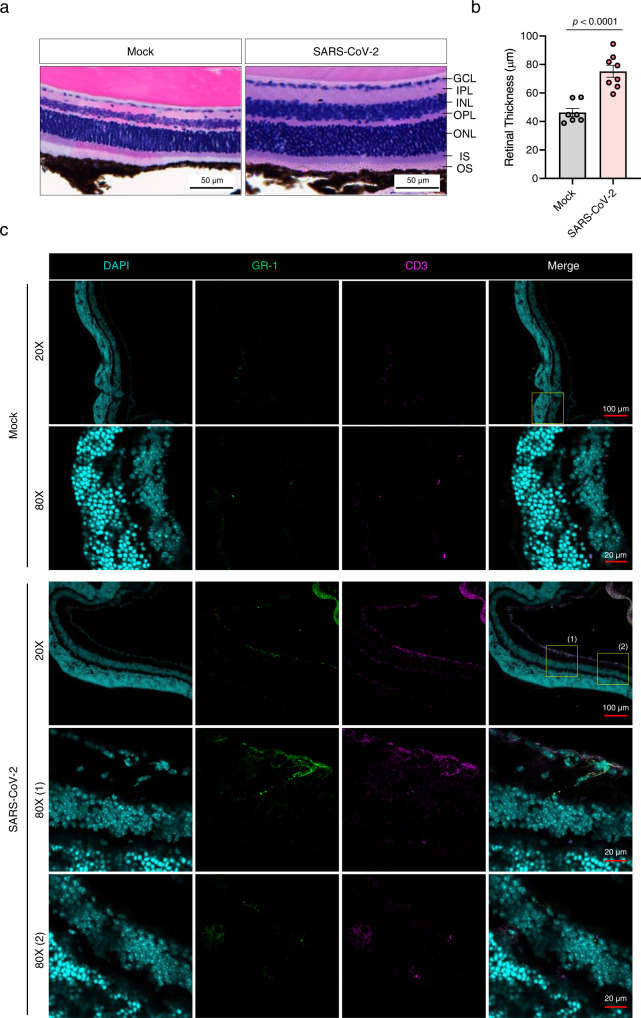
Fig. 2. Histopathological and immunofluorescence analyses of the eyes of SARS-Cov-2-infected mice.
a H&E staining of the eye sections from K18-hACE2 mice six days post mock infection or SARS-CoV-2 infection (104 PFU). Representative histological images (n = 4 per group) show changes in the retinal thickness. Scale bar = 50 μm. b The retinal thickness (n = 4 per group, total eight eyes) was measured and shown in a bar graph (Mock, Grey; SARS-CoV-2, Red). Symbols represent means ± SEM. Statistically significant differences between the groups were determined using an unpaired two-tailed t-test. c Immunofluorescence analysis of eye tissues from SARS-CoV-2-infected mice (mock, n = 8; SARS-CoV-2, n = 10) at 6 dpi. Cryosections were labelled for Gr-1 (neutrophils), CD3 (T cells), and DAPI (nucleus). The differences in the infiltration of Gr-1 neutrophils and CD3+ T cells between mock- and SARS-CoV-2-infected mice are shown in the images. The confocal microscopy images were acquired using a 20× and 40× (with 2× zoom) objective. Scale bars in panel = 100 µm for 20× objective; 20 µm for 40× (with 2× zoom) objective. Data were representative of two independent experiments. SARS-CoV-2 severe acute respiratory syndrome coronavirus 2, GCL ganglion cell layer, IPL inner plexiform layer, INL inner nuclear layer, OPL outer plexiform layer, ONL outer-nuclear layer, IS inner segments, OS outer segments, dpi days post-infection.

