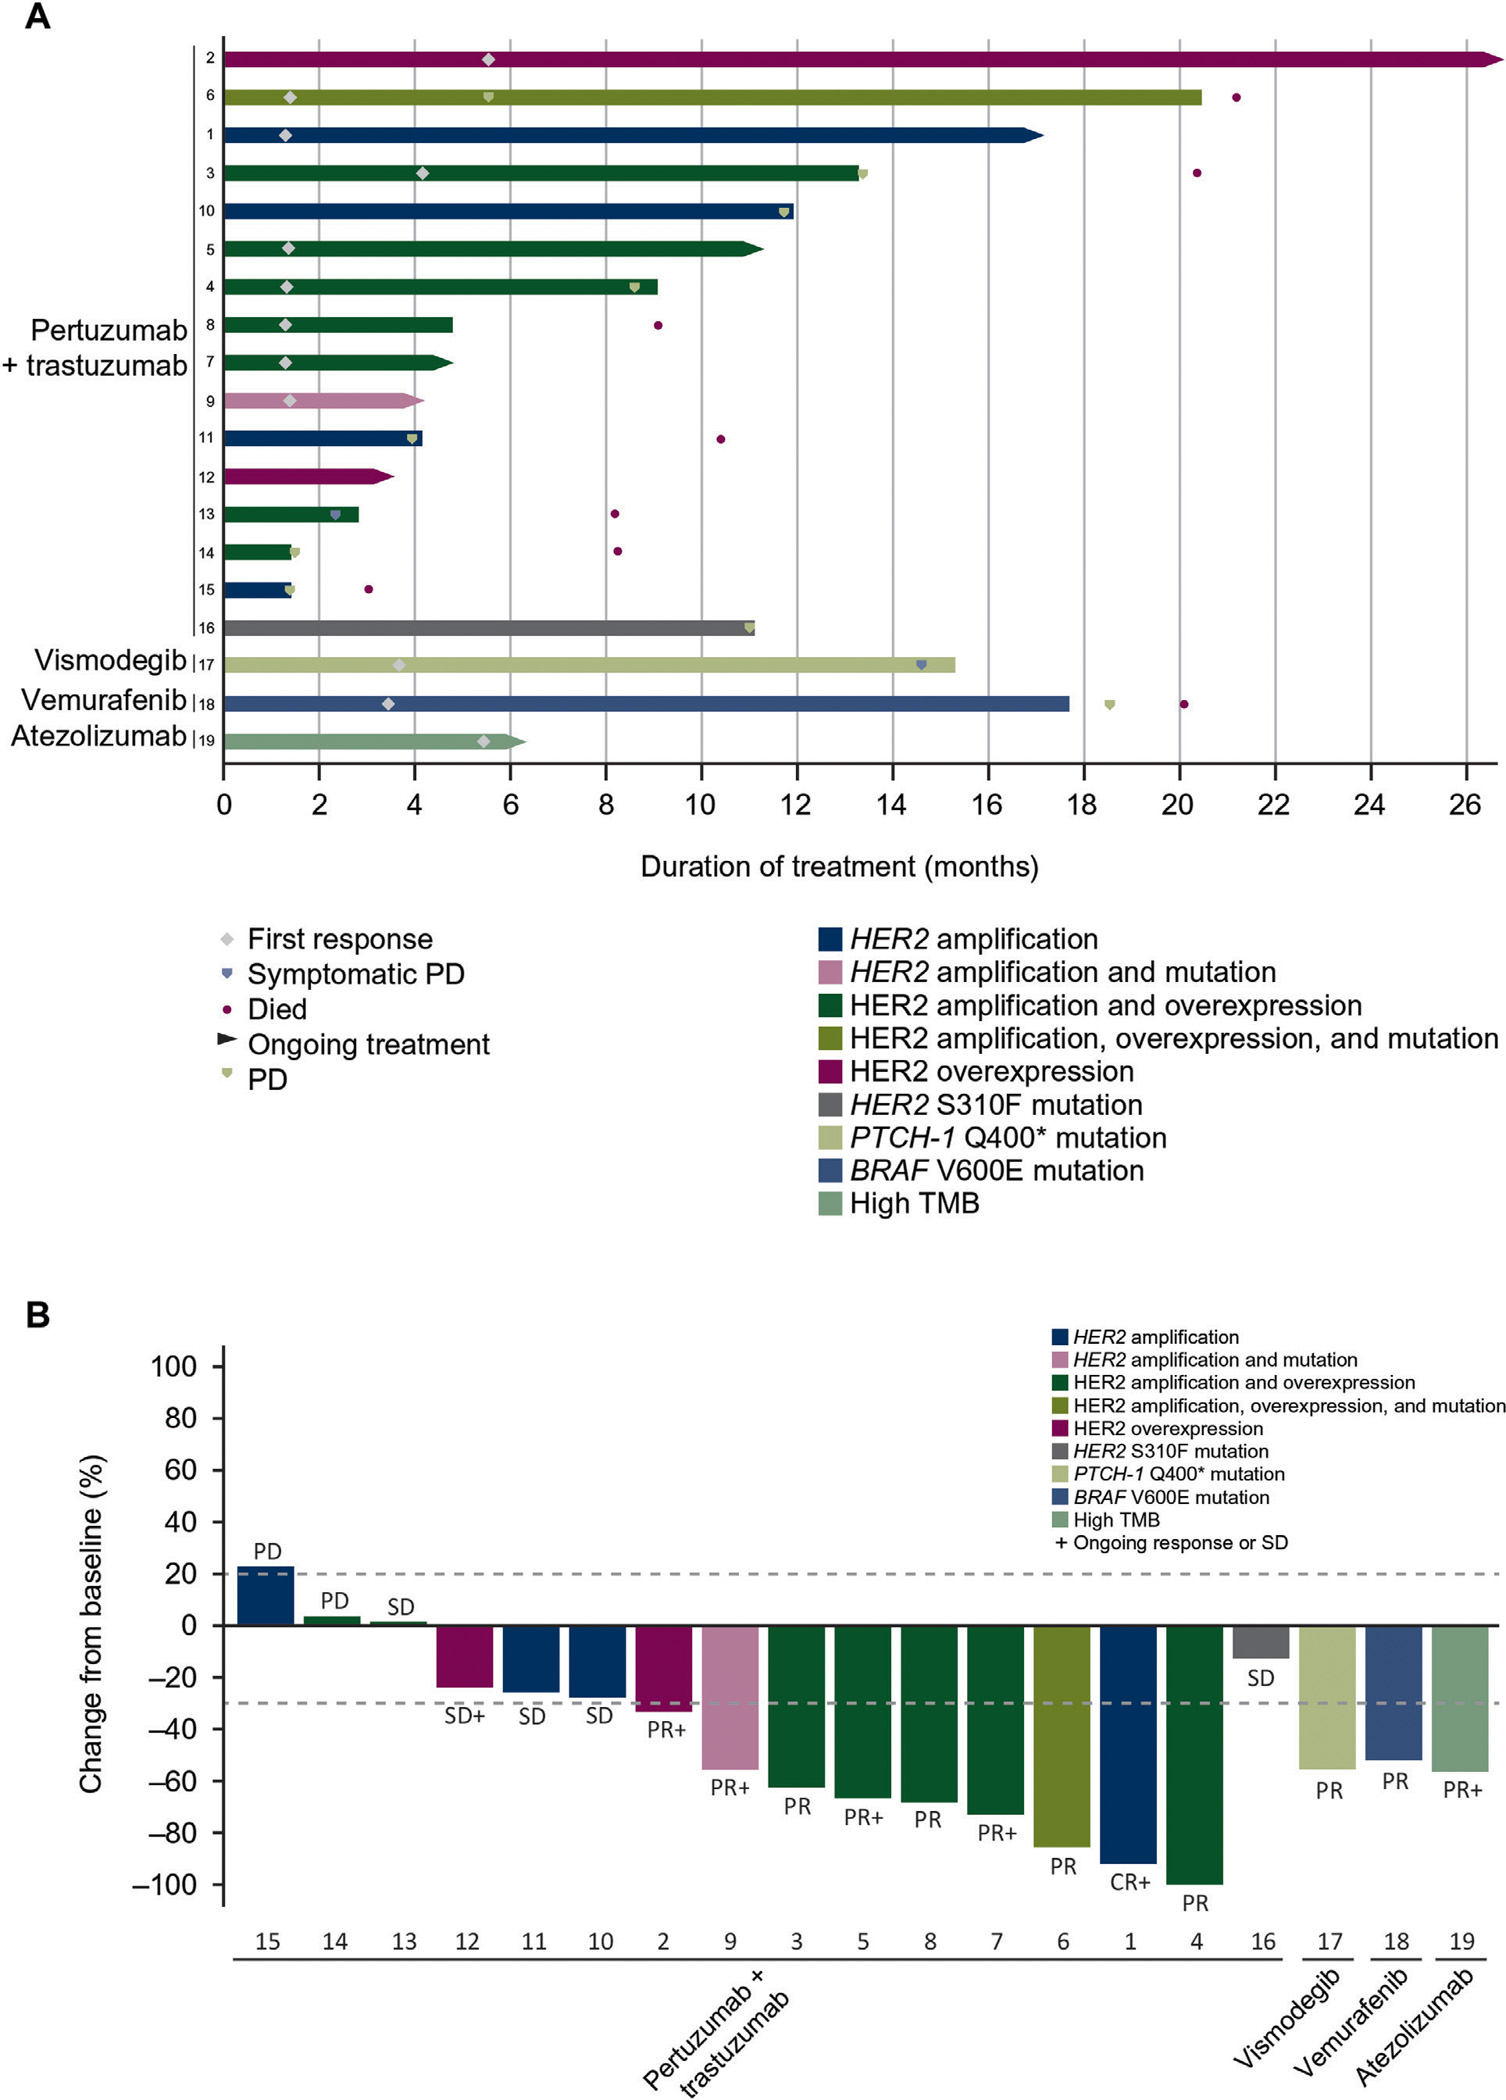
Figure 1. Time on treatment and (B) best change in target lesion size by patient.

(A) (n = 19).a CR, complete response; HER2, human epidermal growth factor receptor 2; Hh, Hedgehog; PD, progressive disease; PR, partial response; PTCH-1, patched homolog-1; SD, stable disease; TMB, tumor mutational burden.
a Lanes represent individual patients.
