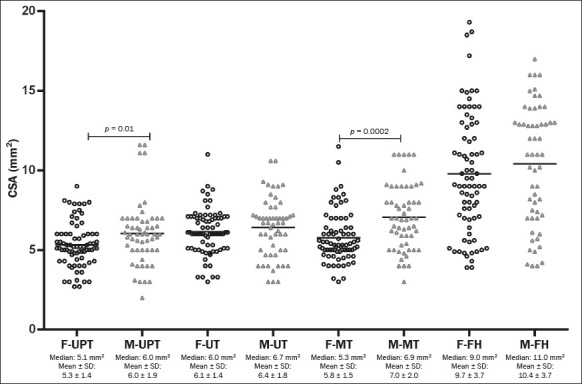
Figure 4.

Column chart showing the distribution of CSA values (mm2) for the neural sites evaluated, by sex. The individual means and standard deviations of the absolute CSA values at the UPT, UT, MT, and FH sites were compared between the sexes by nonparametric and unpaired analysis with the Mann-Whitney test. The data show a trend toward higher values for men, although the difference was significant only for the UPT and MT. F, female; M, male; SD, standard deviation.
