Fig. 7.
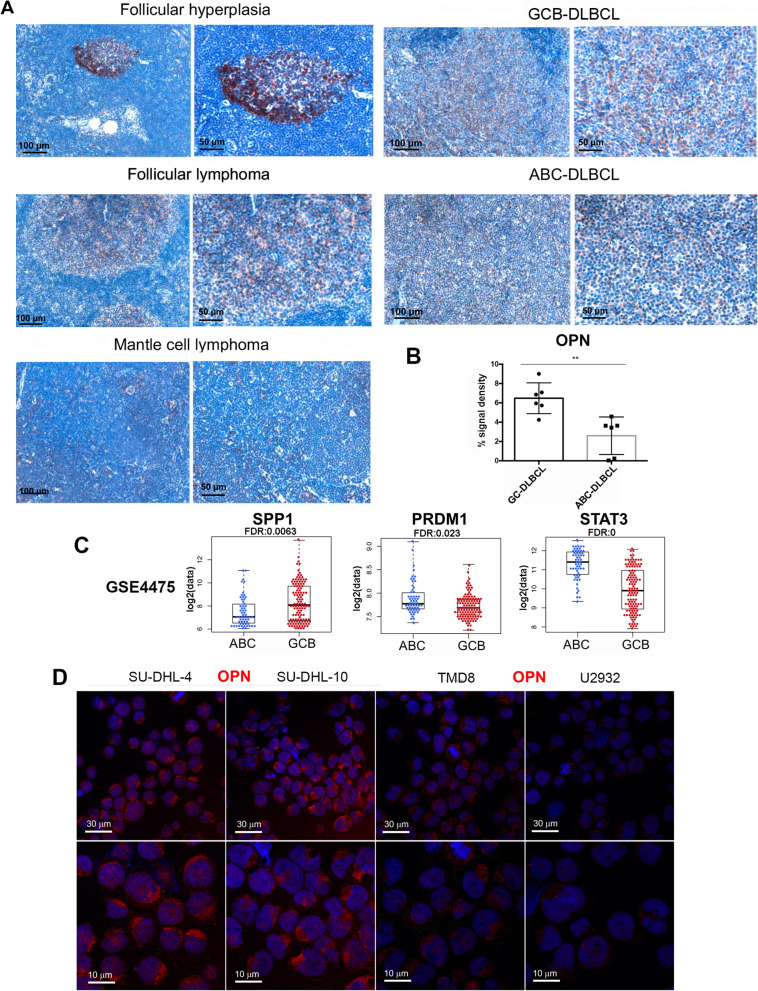
Evaluation of OPN expression in human DLBCL samples and cell lines. A. Representative IHC for OPN performed on human lymphoma biopsies. Scale bar: 100 μm (left) and 50 μm (right). B. Quantification of OPN expression on GC- vs ABC-DLBCL samples (Student t test; **, p: 0.0036). Six cases were analyzed for each subtype. Quantification was performed analysing 5 areas/sample by using Positive Pixel count v9 Leica Software Image Analysis algorithm. C. Boxplots showing the expression of SPP1 (Student t test; *** p: 0.0009), PRDM1 (Student t test, **, p: 0.0047) and STAT3 (Student t test, ****, p: 4.863E-14) in ABC- VS GCB-DLBCL samples in GSE4475. Dots in boxplot represent the expression of the selected gene in each sample. D. Immunofluorescence on cytospin preparation showing OPN expression in SU-DHL-4 and SU-DHL-10 (GC-DLBCL-s), TMD8 and U2932 (ABC-DLBCL) cell lines. Scale bar: 30 μm (upper panels) and 10 μm (lower panel)

