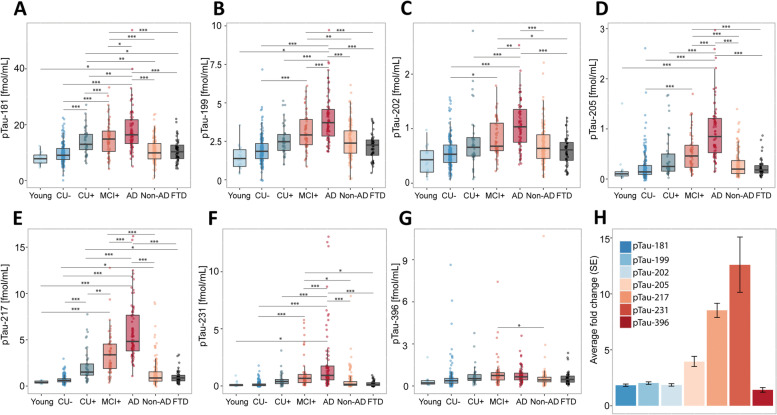
Fig. 2.
Abundances of phosphorylated tau epitopes across the Alzheimer’s disease spectrum in the BioFINDER-2 cohort (A-G). The concentrations of the seven phosphorylated tau epitopes, pTau-181 (A), pTau-199 (B), pTau-202 (C), pTau-205 (D), pTau-217 (E), pTau-231 (F) and pTau-396 (G) are plotted for the different groups. The boxplots depict the median (horizontal bar), interquartile range (IQR, hinges) and 1.5 × IQR (whiskers). Group comparisons were computed with a one-way ANCOVA adjusting for age and sex. Tukey honestly significant difference (HSD) test was used for the post hoc pairwise comparisons in all cohorts. Biomarker fold change, presented in (H) between CU- and Alzheimer’s disease groups. Abbreviations: Aβ, amyloid-β, AD, Alzheimer’s disease; CU-, Aβ-negative cognitively unimpaired; CU + , Aβ-positive cognitively unimpaired; MCI + , Aβ-positive mild cognitive impairment; Non-AD, Aβ-negative “AD” dementia or mild cognitive impairment patients; Other. *P < 0.05; **P < 0.01, ***P < 0.001

