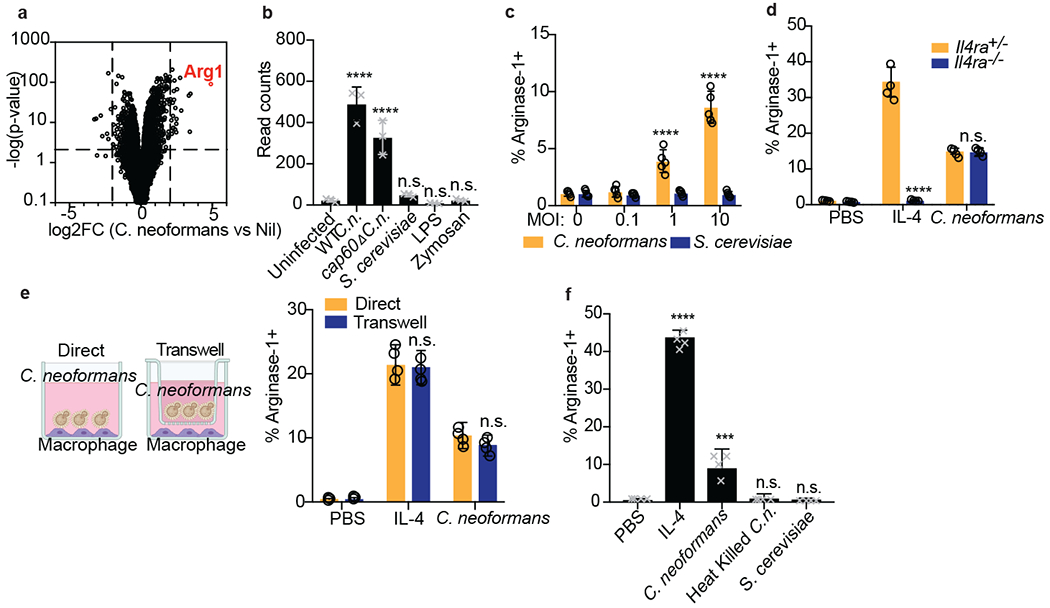
Figure 1. Cryptococcus promotes arginase-1 expression in macrophages via a soluble, capsule-independent mechanism.

(a) Volcano plot of RNA-seq data showing uniquely differentially expressed genes (filtered on genes with <2 fold change in S. cerevisiae challenge) between uninfected and 6hrs wild type C. neoformans MOI=10 infected BMDMs based on DESeq2 analysis. Three biological replicates were used for each condition. (b) Normalized RNA-seq data on BMDMs stimulated for 6hrs with either WT C.n., cap60Δ C.n., S. cerevisiae (all at MOI=10), LPS (100ng/ml), or zymosan (10ug/ml). Three biological replicates were used for each condition. (c) Intracellular FACS staining for arginase-1 after 24hrs of infection with either C. neoformans or S. cerevisiae at the indicated MOIs. n = five biologically independent samples. (d) Arginase-1 intracellular FACS on either Il4ra+/− or Il4ra−/− BMDMs stimulated for 24hrs with IL-4 (40ng/ml) or WT C.n. (MOI=10). n = four biologically independent samples. (e) Arginase-1 intracellular FACS with identical conditions as in (d), but with the stimuli either added directly to the BMDMs or added to the top of a 0.2um transwell insert (image created with Biorender.com). n = four biologically independent samples. (f) Arginase-1 FACS on BMDMs stimulated for 24hrs with IL-4 (40ng/ml), live WT C.n., heat killed (55C for 15min) WT C.n., or S. cerevisiae (all MOI=10). n = four biologically independent samples. Data are presented as mean values +/− SD. ***p < 0.001; ****p < 0.0001 by one-way ANOVA with Bonferroni test.
