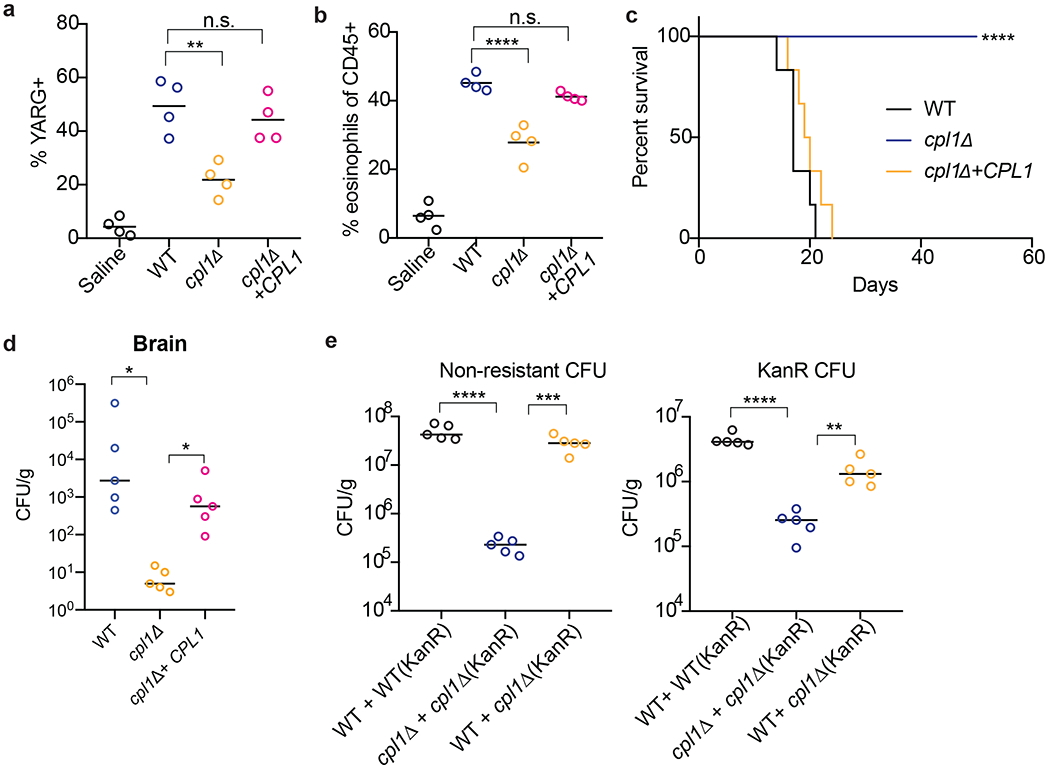
Extended Data Figure 8.

(a) Quantification of YARG expression by FACS in lung interstitial macrophages in mice infected for 10 days with 5x10⁴ CFU of the indicated strains. (b) Quantification of eosinophils in mice infected for 10 days with 5x10⁴ CFU of the indicated strains. (c) Kaplan-Meier survival curve analysis of mice infected with WT, cpl1Δ, or cpl1Δ+CPL1 C.n. (N=6 mice per group); ****p < 0.0001 by Mantel-Cox test. (d) Brain CFUs from mice infected with WT, cpl1Δ, or cpl1Δ+CPL1 C.n (5x10⁴ CFU) for 14 days. (e) Lung CFUs on G418-non-resistant (left) or -resistant (right) colonies from mice infected for 10 days with a 50:50 mix of the indicated strains.
