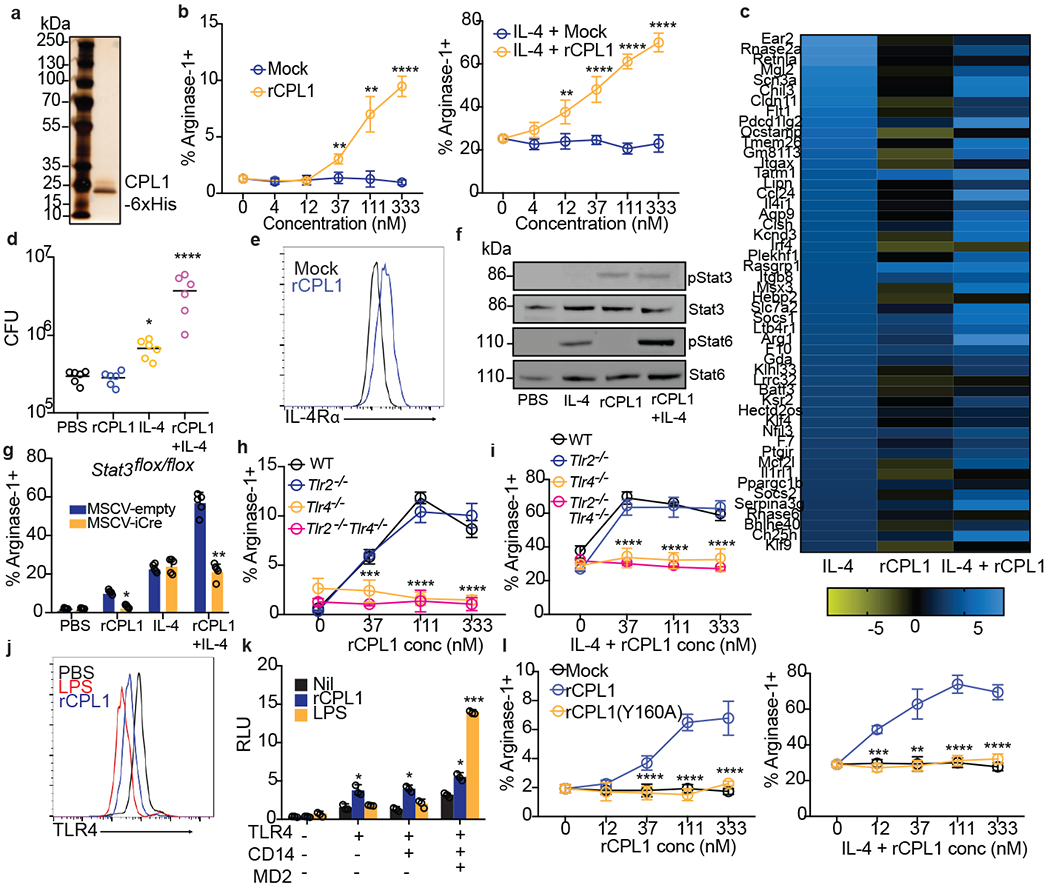
Figure 3. CPL1 potentiates IL-4 signaling via TLR4.

(a) Silver stained SDS-PAGE gel of recombinant CPL1. n = 5 independent experiments. (b) Arginase-1 FACS on BMDMs stimulated for 24hrs with mock or purified rCPL1 alone (left) or with IL-4 (right). n = 3 biologically independent samples. (c) RNA-seq heatmap of the top 50 BMDM IL-4-induced genes comparing the log2 fold changes of indicated stimulations to PBS. (d) C. neoformans CFUs after 48hrs of incubation at 37°C, 5% CO2 in supernatants from BMDMs stimulated for 24hrs as in (c). n = six biologically independent samples. (e) FACS for IL-4Rα levels on BMDMs stimulated for 24hrs with rCPL1 or mock. (f) Western blot for indicated proteins on BMDMs stimulated as in (c) for 8hrs. Data are representative of three independent experiments. (g) Arginase-1 FACS on STAT3flox/flox BMDMs transduced with empty vector or iCre retrovirus and stimulated as in (c). n = five biologically independent samples. (h) Arginase-1 FACS in WT, Tlr2−/−, Tlr4−/−, or Tlr2−/−Tlr4−/− BMDMs stimulated for 24hrs with rCPL1. n = 3 biologically independent samples. (i) Same as (h) but plus IL-4. n = 3 biologically independent samples. (j) FACS for TLR4 levels on BMDMs stimulated for 1hr with LPS (100ng/ml) or rCPL1. n = 3 biological experiments. (k) Luminescence in HEK293T cells transfected with the indicated plasmids plus NF-kB luciferase and stimulated for 6hrs with either rCPL1 or LPS (100ng/ml). n = 3 biologically independent samples. (l) Arginase-1 FACS in BMDMs stimulated for 24hrs with mock, rCPL1, or rCPL1(Y160A) alone (left) or in combination with IL-4 (right). n = 3 biologically independent samples. Concentrations are IL-4 (10ng/ml) and rCPL1 (111nM) unless otherwise noted. Data are presented as mean values +/− SD. *p < 0.05; **p < 0.01; ***p < 0.001; ****p < 0.0001 by one-way ANOVA with Bonferroni test.
