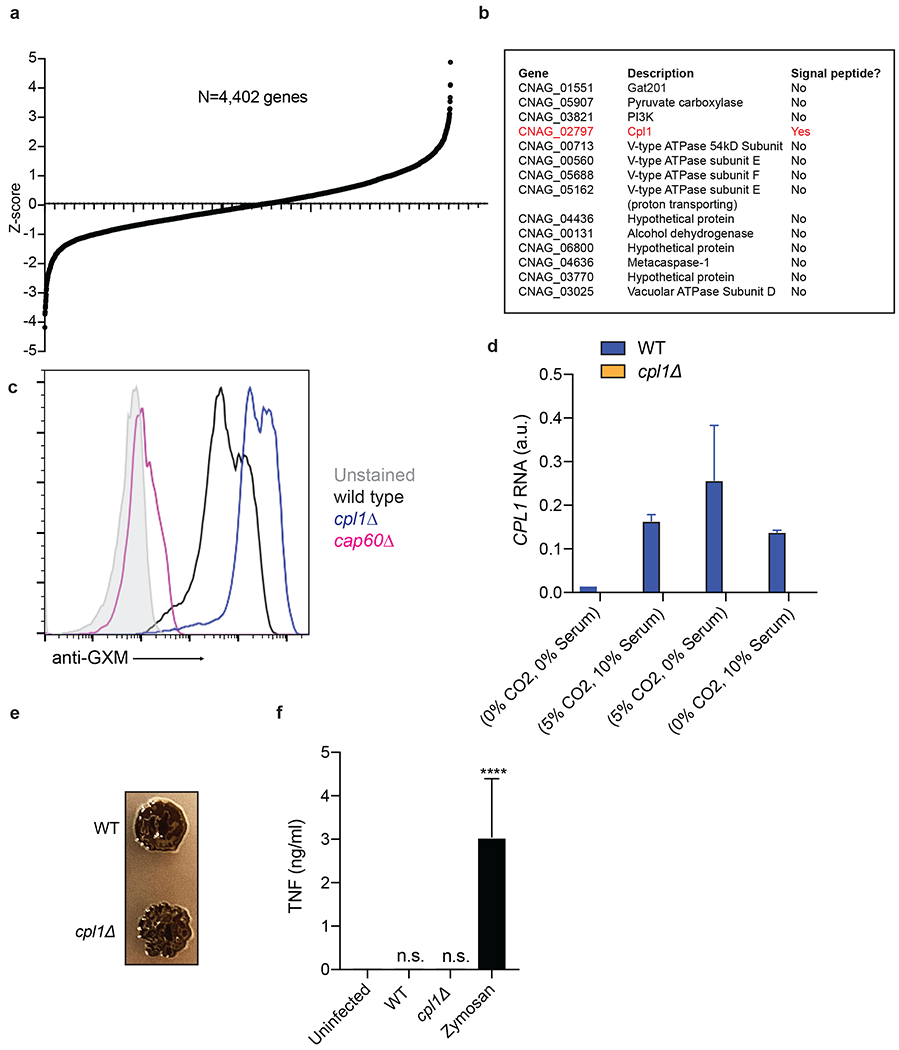
Extended Data Figure 2.

(a) Ranked Z-scores of hits from forward genetic screen for C. neoformans Arg1 induction. (b) List of validated screen hits and gene descriptions. (c) Representative FACS histograms of GXM staining on the indicated C. neoformans strains cultured overnight in 10% Sabouraud media. (d) RT-qPCR for CPL1 mRNA expression in cultures grown to OD600=1.0 in the indicated conditions (A.U. = arbitrary units relative to ACT1). n = three biologically independent samples. (e) Melanin production in WT or cpl1Δ strains grown at 30°C on L-DOPA plates. (f) TNF production (measured by ELISA) to the indicated stimulations. n = six biologically independent samples. Significance determined by one-way ANOVA with Bonferroni test. Data are presented as mean values +/− SD. ****p < 0.0001.
