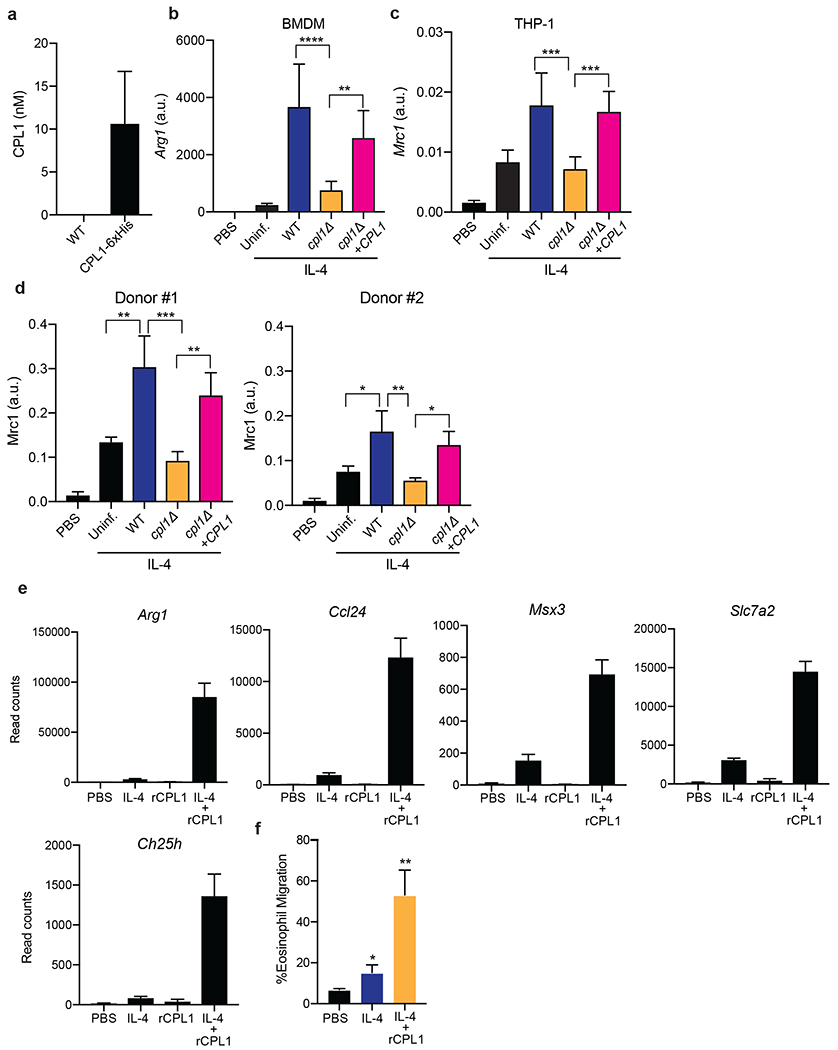
Extended Data Figure 3.

(a) Quantification by competitive ELISA of CPL1-6xHis in supernatants from the indicated strains grown in mammalian tissue culture conditions to OD=1.0. n = six biologically independent samples. (b) RT-qPCR for Arg1 mRNA in BMDMs stimulated with the indicated C. neoformans strains (OD=0.1) along with IL-4 (10ng/ml) for 24hrs. Expression normalized to Actb, a.u. = arbitrary units. n = three biologically independent samples. (c) RT-qPCR for Mrc1 mRNA in PMA-differentiated THP-1 cells stimulated with the indicated C. neoformans strains (OD=0.1) along with IL-4 (10ng/ml) for 24hrs. Expression normalized to Actb, a.u. = arbitrary units. n = six biologically independent samples (d) RT-qPCR for Mrc1 mRNA in primary human monocyte-derived macrophages stimulated for 24hrs with PBS or recombinant human IL-4 (10ng/ml) along with the indicated C. neoformans strains (MOI=0.1). Expression normalized to Actb, a.u. = arbitrary units. n = three biologically independent samples (e) RNA-seq read counts of the indicated genes in BMDMs stimulated for 24hrs with either PBS, IL-4 (10ng/ml), rCPL1 (111nM), or IL-4 + rCPL1. n = three biologically independent samples. (f) Transwell migration assay on splenic eosinophils towards supernatants from BMDMs stimulated as in (e). n = three biologically independent samples. Data are presented as mean values +/− SD.
